
1
1
CompuTherm LLC – www.computherm.com
Types of Binary Phase Diagrams
• Isomorphous Systems
• Eutectic Systems
• Eutectoid Systems
• Peritectic Systems
• Peritectoid Systems
• Monotectic Systems
• Syntectic Systems

2
2
CompuTherm LLC – www.computherm.com
Isomorphous Systems
Isomorphous:
Two elements are completely soluble in each other in solid and
liquid states; substitutional solid state solution can be formed;
single type of crystal structure exists.
Hume-Rothery Rules:
(1) atoms have similar radii;
(2) both pure materials have same crystal structure;
(3) similar electronegativity (otherwise may form a compound
instead);
(4) solute should have higher valence.
Example:
Cu-Ni (slow cooling conditions), Mo-Nb, Mo-V, ...
3
3
CompuTherm LLC – www.computherm.com
Isomorphous Systems
Information from this diagram:
• Pure Ni melts at 1455
o
C
• Pure Cu melts at 1085
o
C
• Pure component melts at a
fixed temperature, an alloy
melts in a temperature range.
• Cu-80at%Ni starts to melt at
1382
o
C (solidus), and becomes
complete liquid at 1398
o
C
(liquidus)
• Liquid and solid coexist
between the liquidus and
solidus temperatures
4
4
CompuTherm LLC – www.computherm.com
Information Obtained from both the Phase
Diagram and the G-x Diagram:
At the given temperature T=1300
o
C
1. On the left of x
L
, Liquid is most stable
2. On the right of x
a
, a phase is stable
3. Between x
L
and x
a
the two-phase mixture is
stable
x
L
x
a
( )
LL
B
L
A
L
B
L
B
L
A
L
A
L
B
L
B
L
A
L
A
L
xxxxxxRTGxGxG
++++= lnln
( )
aaaaaaaaaaaa
BABBAABBAA
xxxxxxRTGxGxG ++++= lnln
Phase Diagram vs. Gibbs Energy Curve
5
5
CompuTherm LLC – www.computherm.com
x
L
x
a
x
L
x
a
Phase Diagram vs. Gibbs Energy Curve
6
6
CompuTherm LLC – www.computherm.com
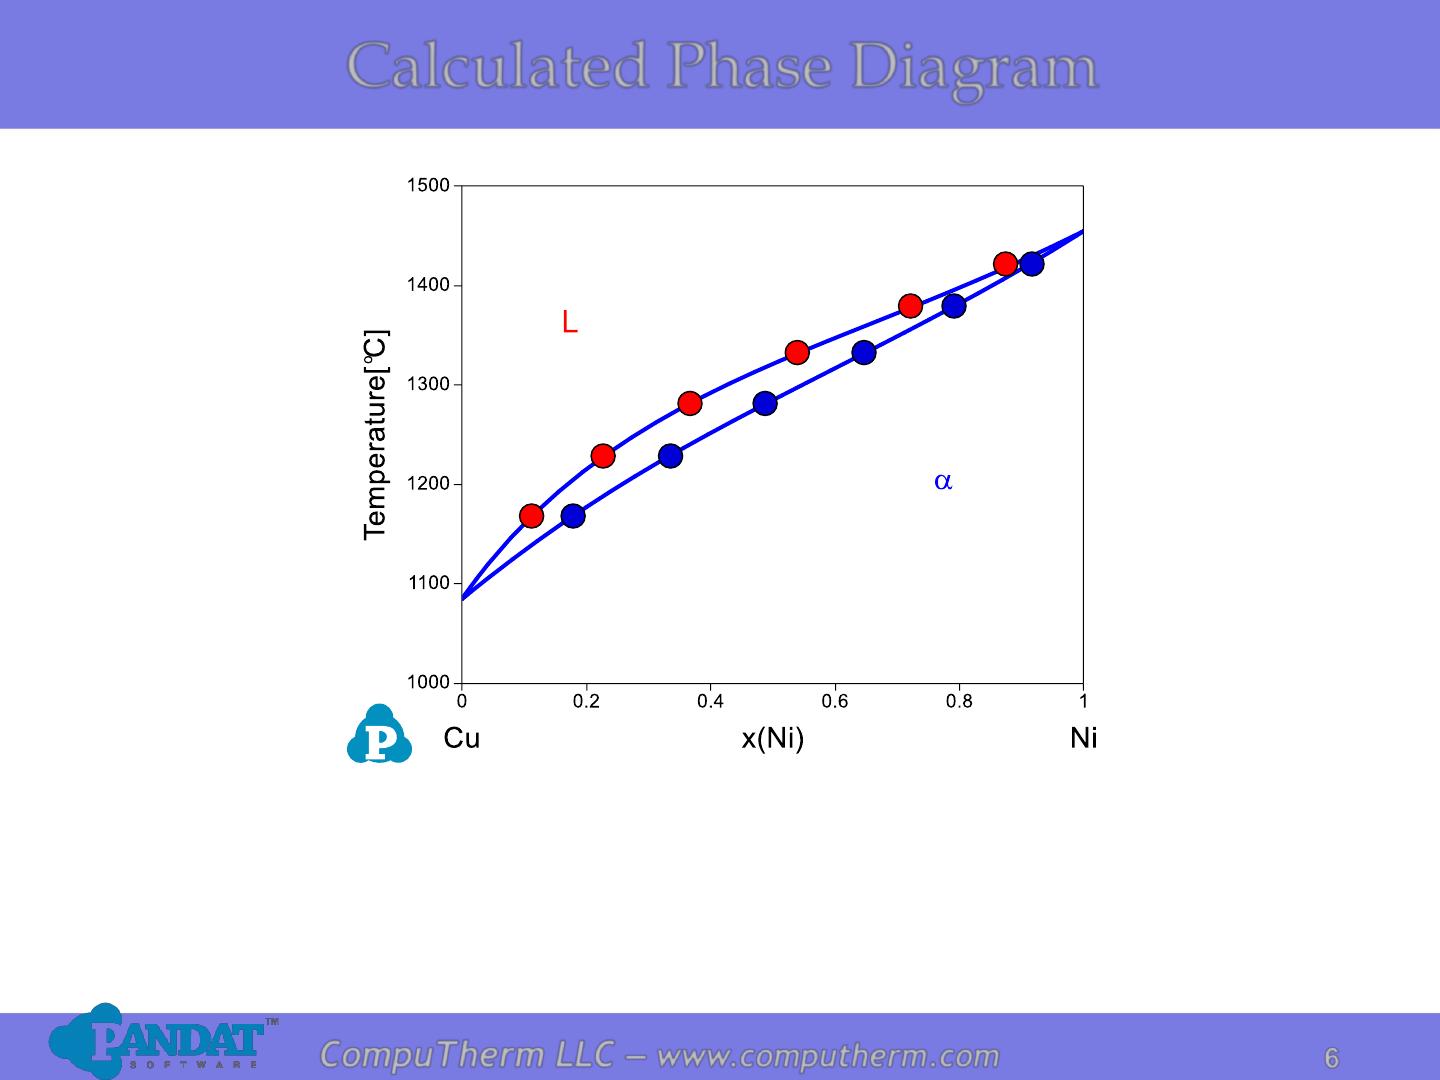
Details Refer to:
1. Database: Database_Isomorphous_Cu-Ni.tdb
2. Tutorial Video: Binary_Isomorphous
Calculated Phase Diagram
7
7
CompuTherm LLC – www.computherm.com
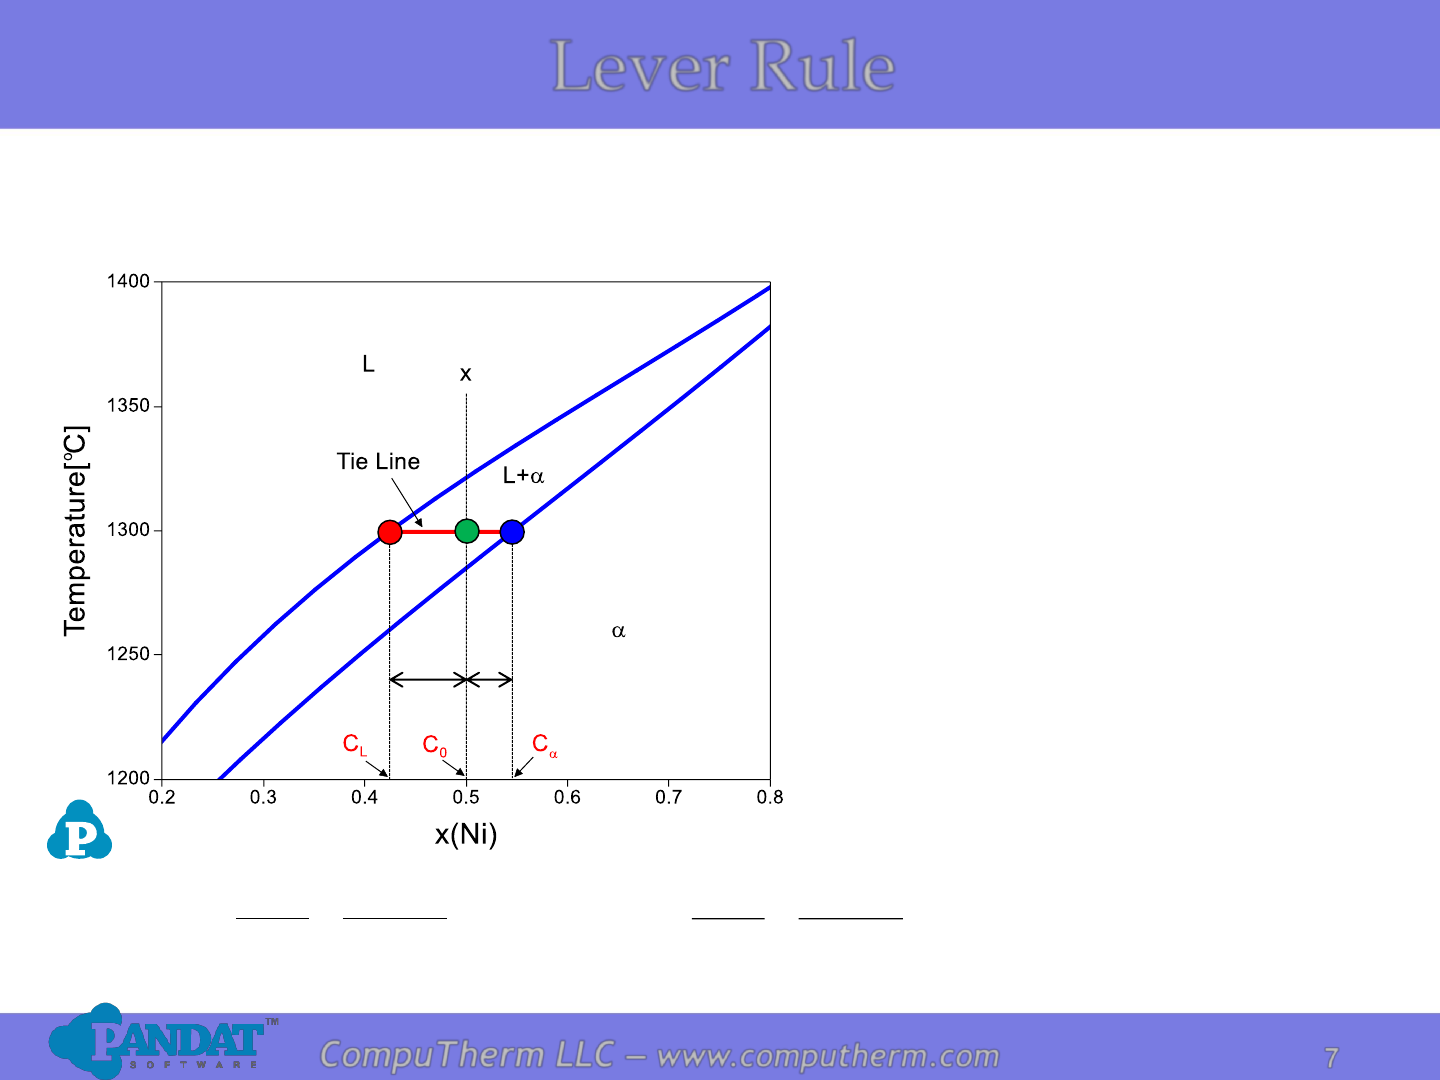
Finding the amounts of phases
in a two-phase region:
1. Locate composition and
temperature in diagram
2. In two-phase region draw the
tie line
3. Fraction of a phase is
determined by taking the
length of the tie line to the
phase boundary for the other
phase, and divided by the
total length of tie line
L
L
CC
CC
SR
S
F
−
−
=
+
=
a
a
0
L
L
CC
CC
SR
R
F
−
−
=
+
=
a
a
0
R
S
Lever Rule
8
8
CompuTherm LLC – www.computherm.com
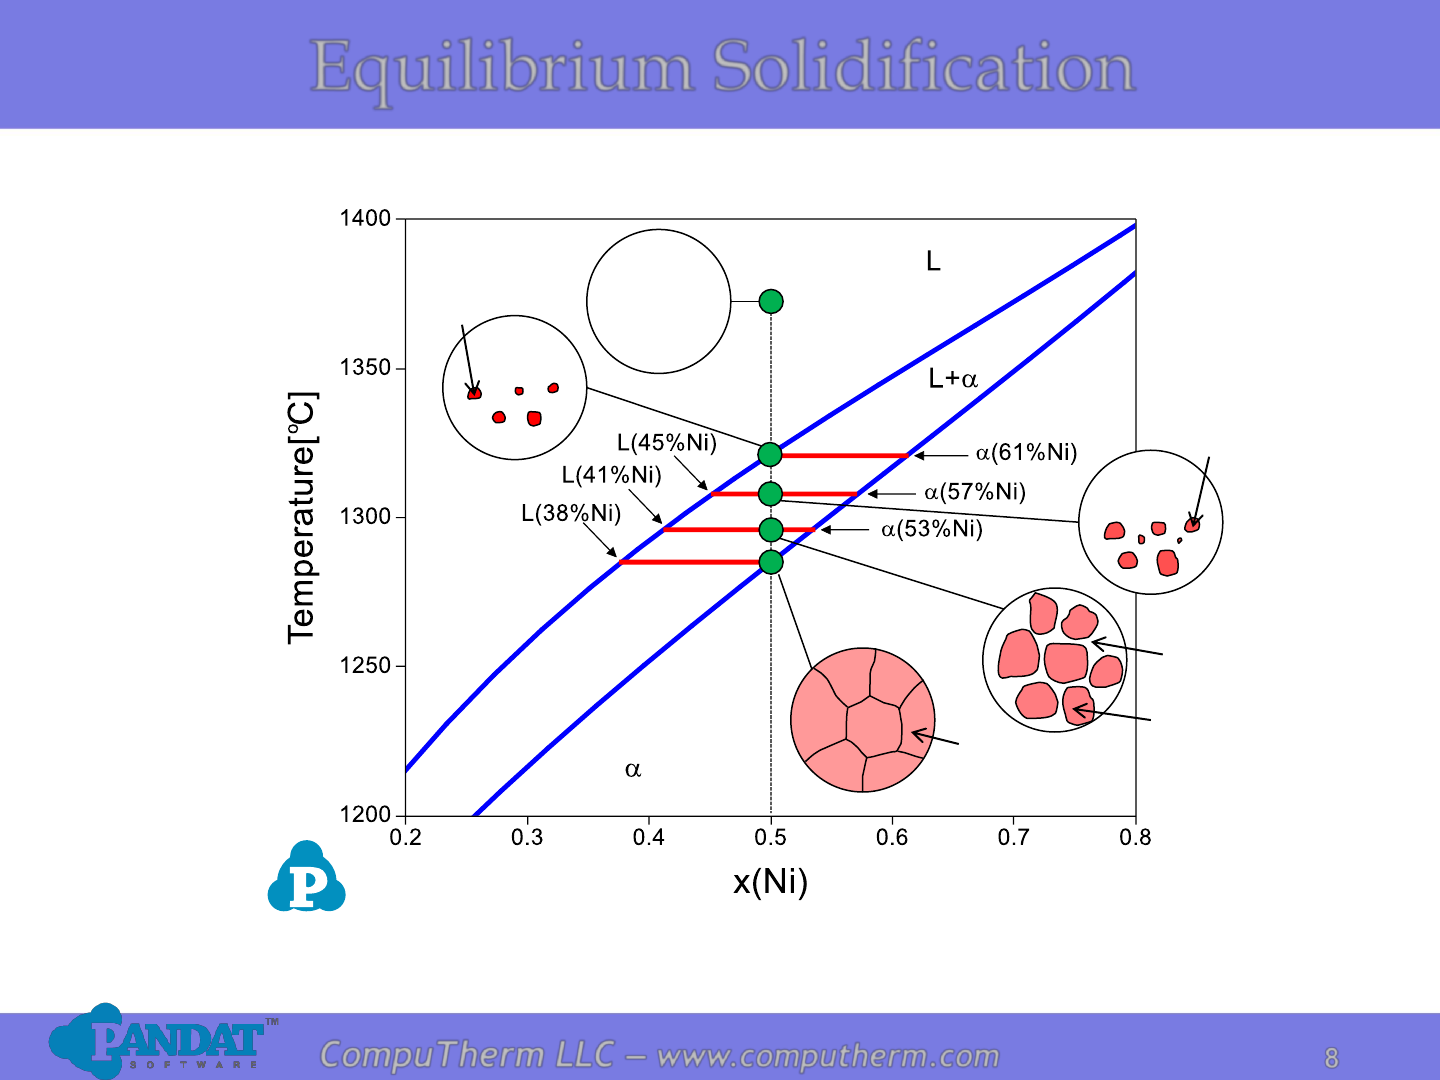
Equilibrium Solidification
L
(50%Ni)
a
(50%Ni)
L
(41%Ni)
a
(53%Ni)
L
(45%Ni)
a
(57%Ni)
L
(50%Ni)
a
(61%Ni)
9
9
CompuTherm LLC – www.computherm.com
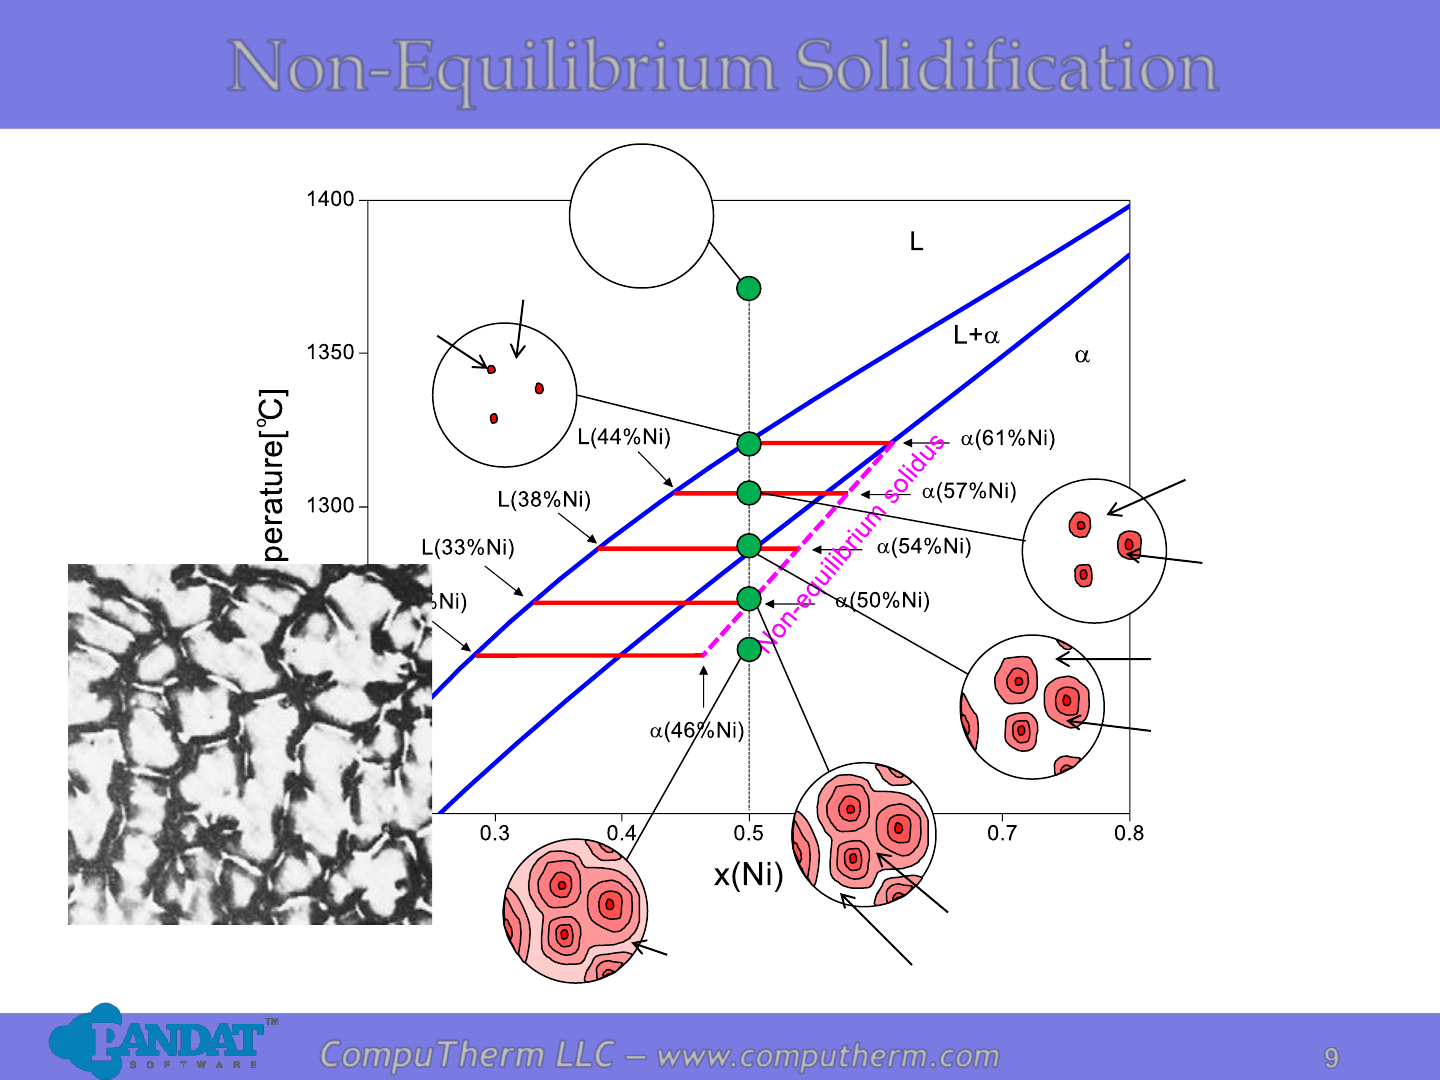
Non-Equilibrium Solidification
a
(61%Ni)
L
(50%Ni)
L
(44%Ni)
a
(57%Ni)
L
(33%Ni)
a
(50%Ni)
a
(46%Ni)
L
(38%Ni)
a
(54%Ni)
L
(50%Ni)
As-cast 70%Cu – 30%Ni alloy
showing a cored structure
Non-equilibrium
solidus due to
undercooling of the
liquid phase and
low diffusion in the
solid phase
10
10
CompuTherm LLC – www.computherm.com
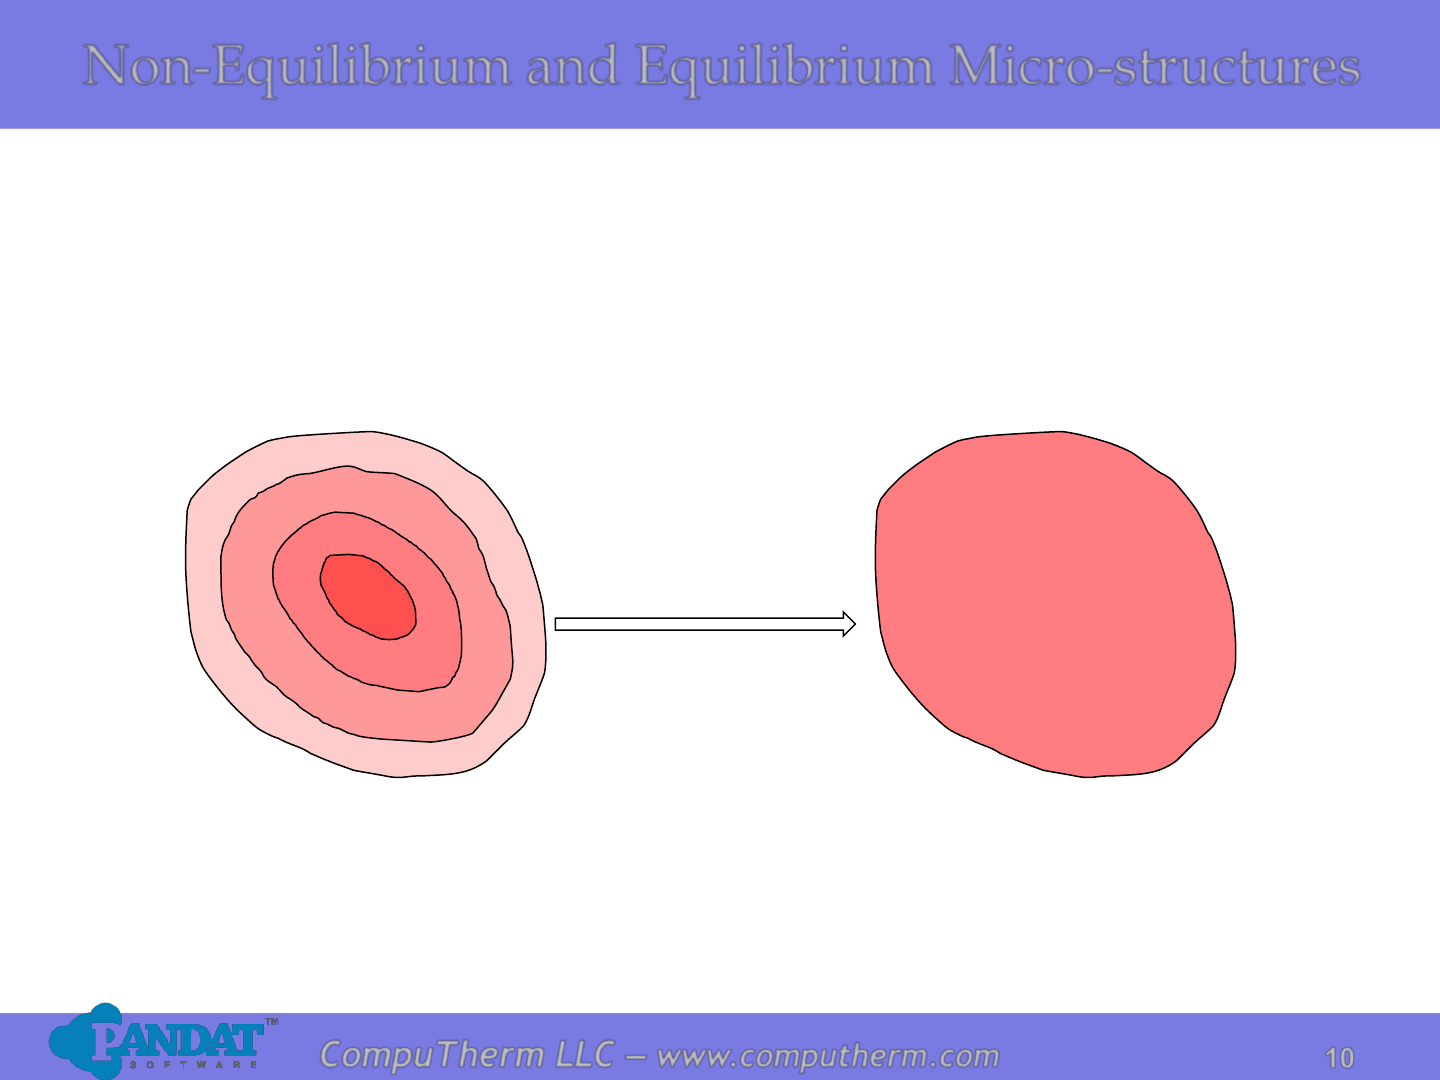
Non-Equilibrium and Equilibrium Micro-structures
Non-Equilibrium Structure
Fast cooling rate
C
a
changes during solidification
Equilibrium Structure
Very slow cooling rate
Uniform C
a
during solidification
Coring can be eliminated by means of a homogenization heat
treatment carried out at temperatures below the alloy’s solidus
Heat Treatment

11
11
CompuTherm LLC – www.computherm.com
Types of Binary Phase Diagrams
• Isomorphous Systems
• Eutectic Systems
• Eutectoid Systems
• Peritectic Systems
• Peritectoid Systems
• Monotectic Systems
• Syntectic Systems
12
12
CompuTherm LLC – www.computherm.com
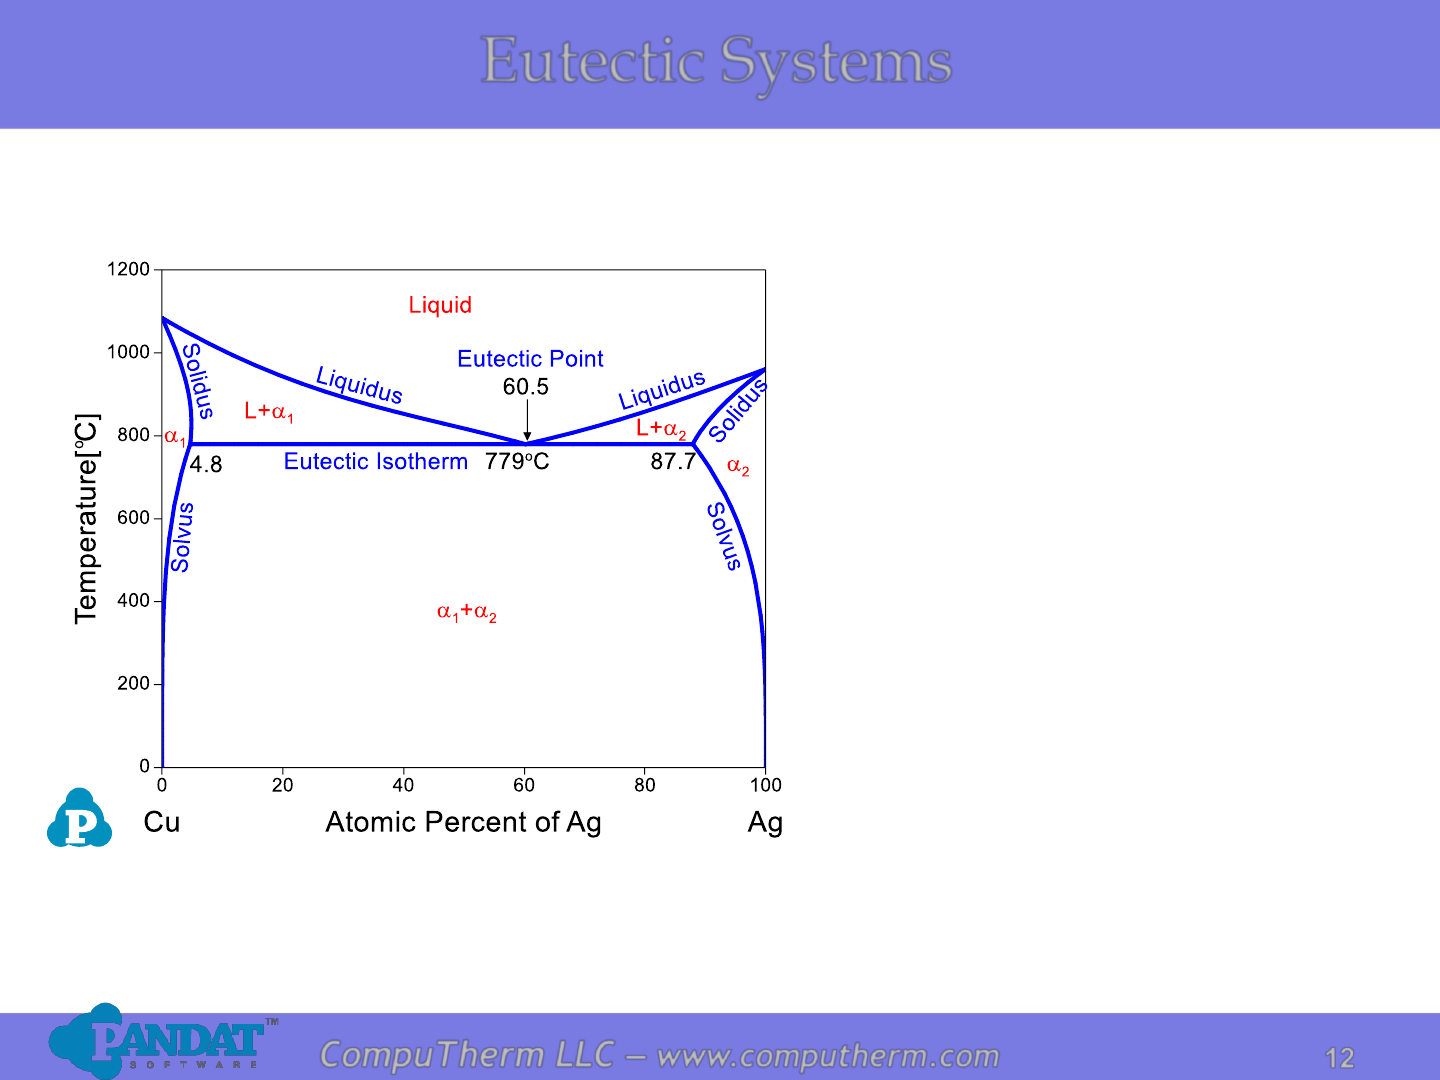
Eutectic Systems
Information from this diagram:
• Eutectic reaction occurs at
779
o
C and 60.5 at% Ag:
L ↔ a
1
+ a
2
.
• Alloy (4.8%<x
Ag
<87.7%) starts
to melt at eutectic reaction
temperature 779
o
C and
becomes complete liquid at
liquidus.
• Alloy (x
Ag
<4.8% or x
Ag
>87.7%)
transforms from two phases to
single phase when crossing
solvus from lower temperature,
starts to melt at solidus, and
becomes complete liquid at
liquidus.
13
13
CompuTherm LLC – www.computherm.com
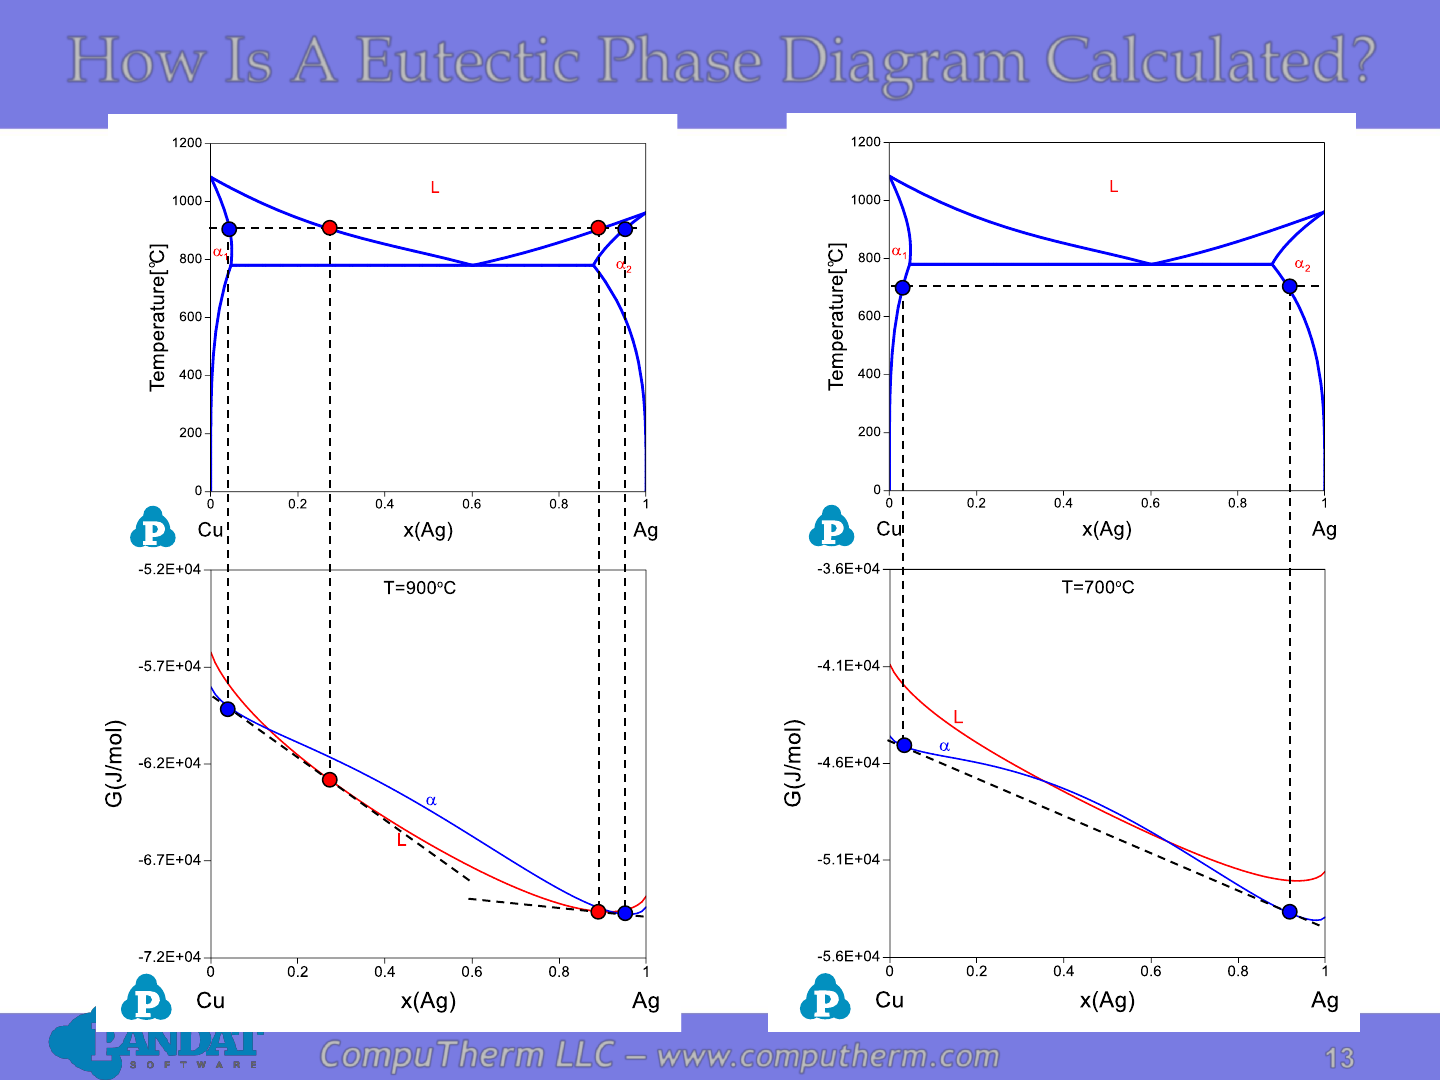
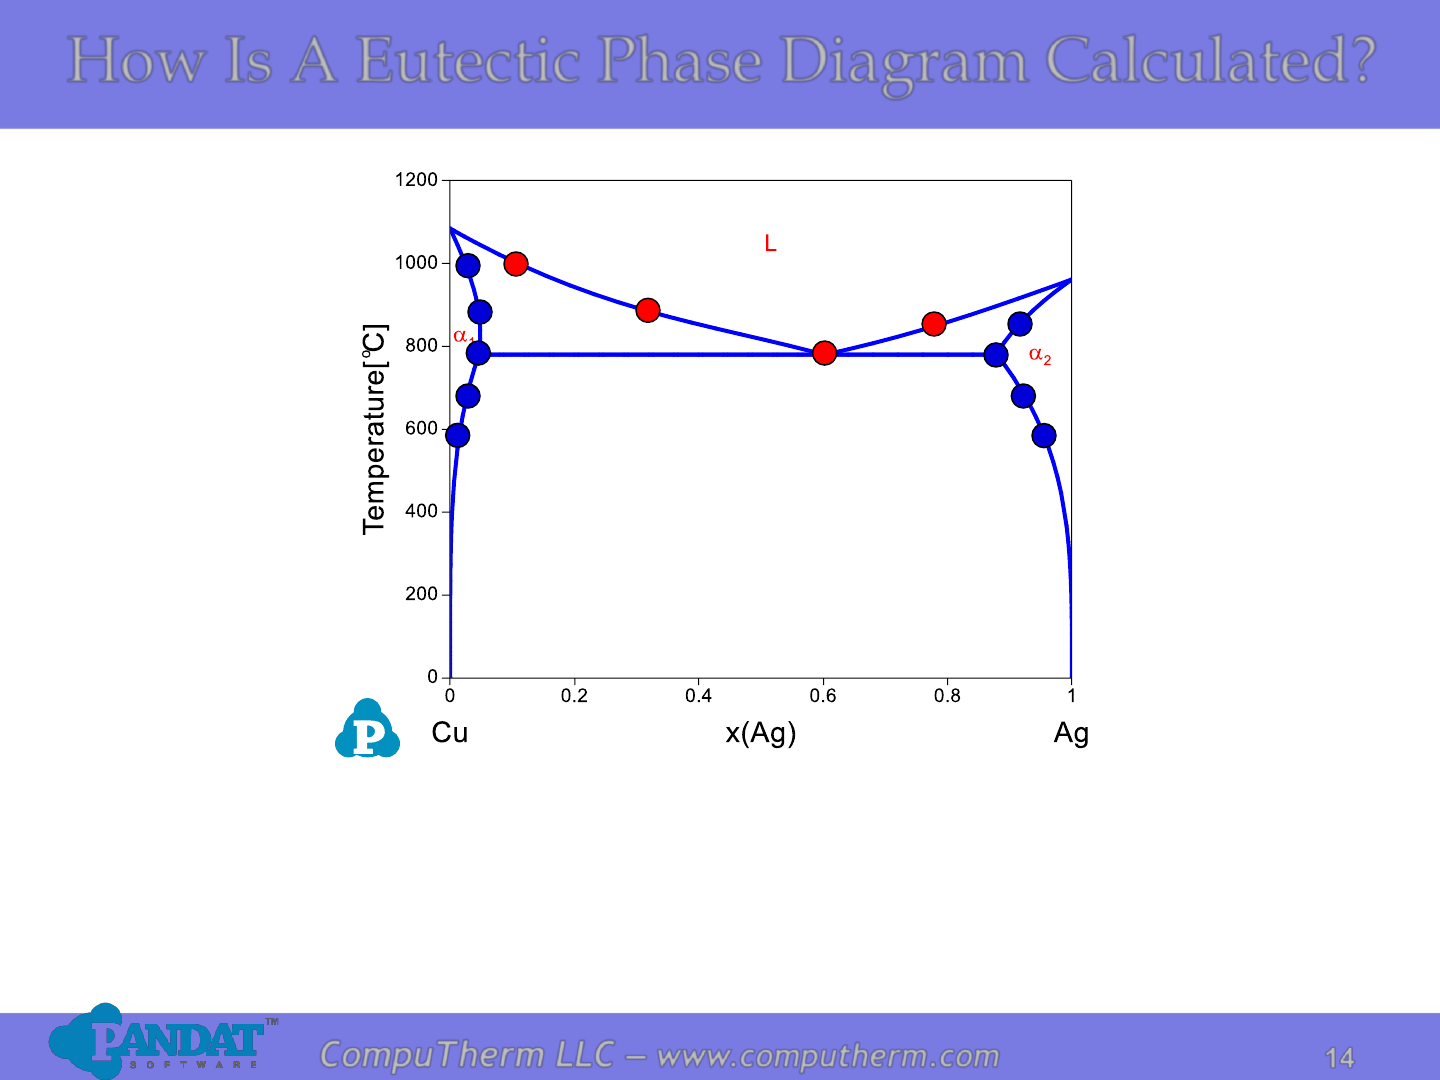
How Is A Eutectic Phase Diagram Calculated?
14
14
CompuTherm LLC – www.computherm.com
How Is A Eutectic Phase Diagram Calculated?
Details Refer to:
1. Database: Database_Eutectic_Cu-Ag.tdb
2. Tutorial Video: Binary_Eutectic
15
15
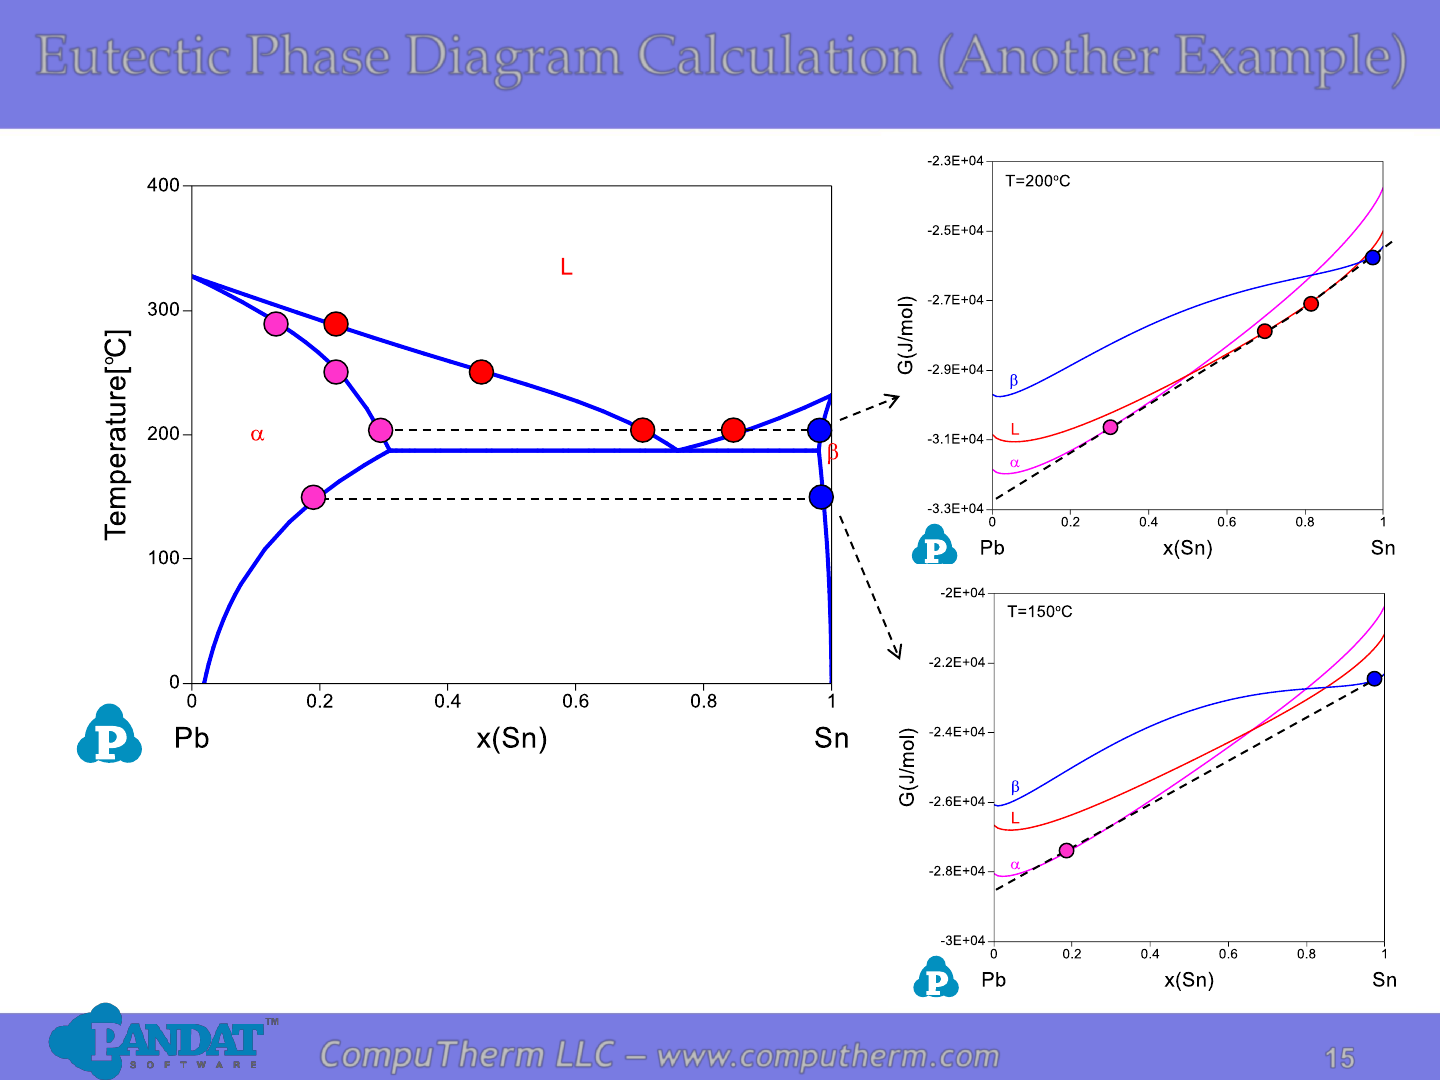
CompuTherm LLC – www.computherm.com
Eutectic Phase Diagram Calculation (Another Example)
Details Refer to:
1. Database: Database_Eutectic_Pb-Sn.tdb
2. Tutorial Video: Binary_Eutectic
16
16
CompuTherm LLC – www.computherm.com
Sn) at% 89( Sn) at% (31 Sn) at% 76(
a
+L
cooling
heating
Microstructure of a Eutectic Alloy, C
0
=C
E
=76 at% Sn
L
(76%Sn)
L
(76%Sn)
a
(31%Sn)
(98%Sn)
a
(31%Sn)
(98%Sn)
The dark layers are Pb-rich
α phase, and the light
layers are Sn-rich β phase.
Photo copyright by Metals Handbook Vol. 9, 1985.
17
17
CompuTherm LLC – www.computherm.com
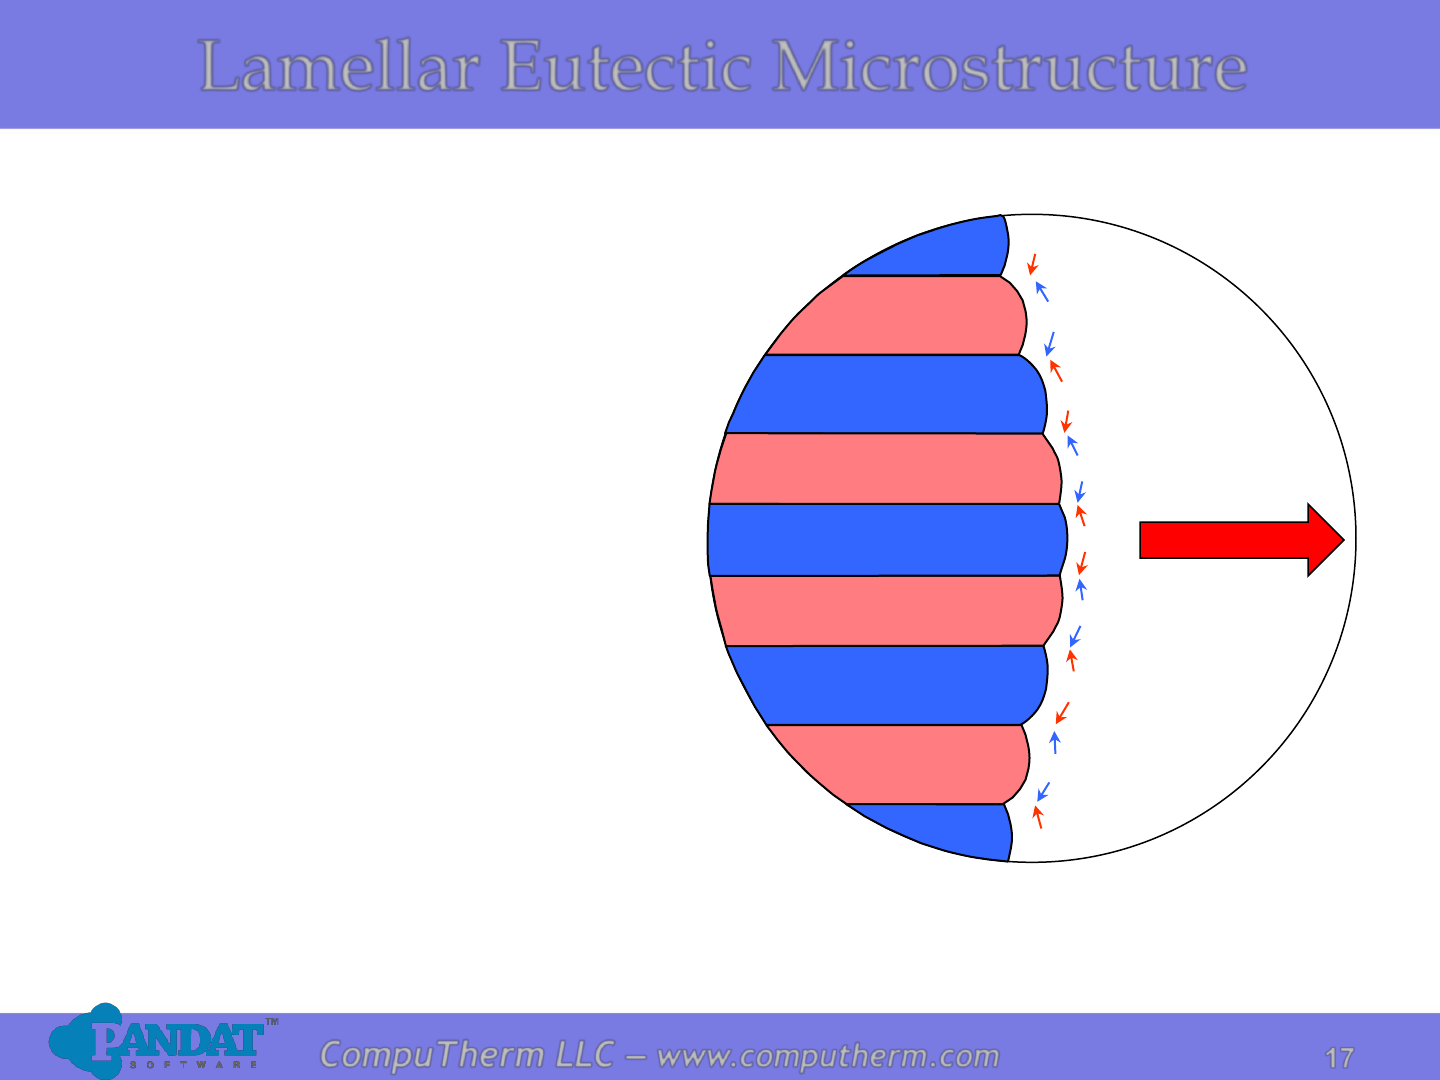
Lamellar Eutectic Microstructure
❑A two-phase lamellar
microstructure resulting
from the solidification of a
liquid having the eutectic
composition.
Eutectic
growth
direction
Liquid
a
a
a
a
Pb
Pb
Pb
Pb
Pb
Sn
Sn
Sn
Sn
❑Compositions of α and β
phases are very different.
Solidification involves
redistribution of Pb and Sn
atoms by atomic diffusion.
18
18
CompuTherm LLC – www.computherm.com
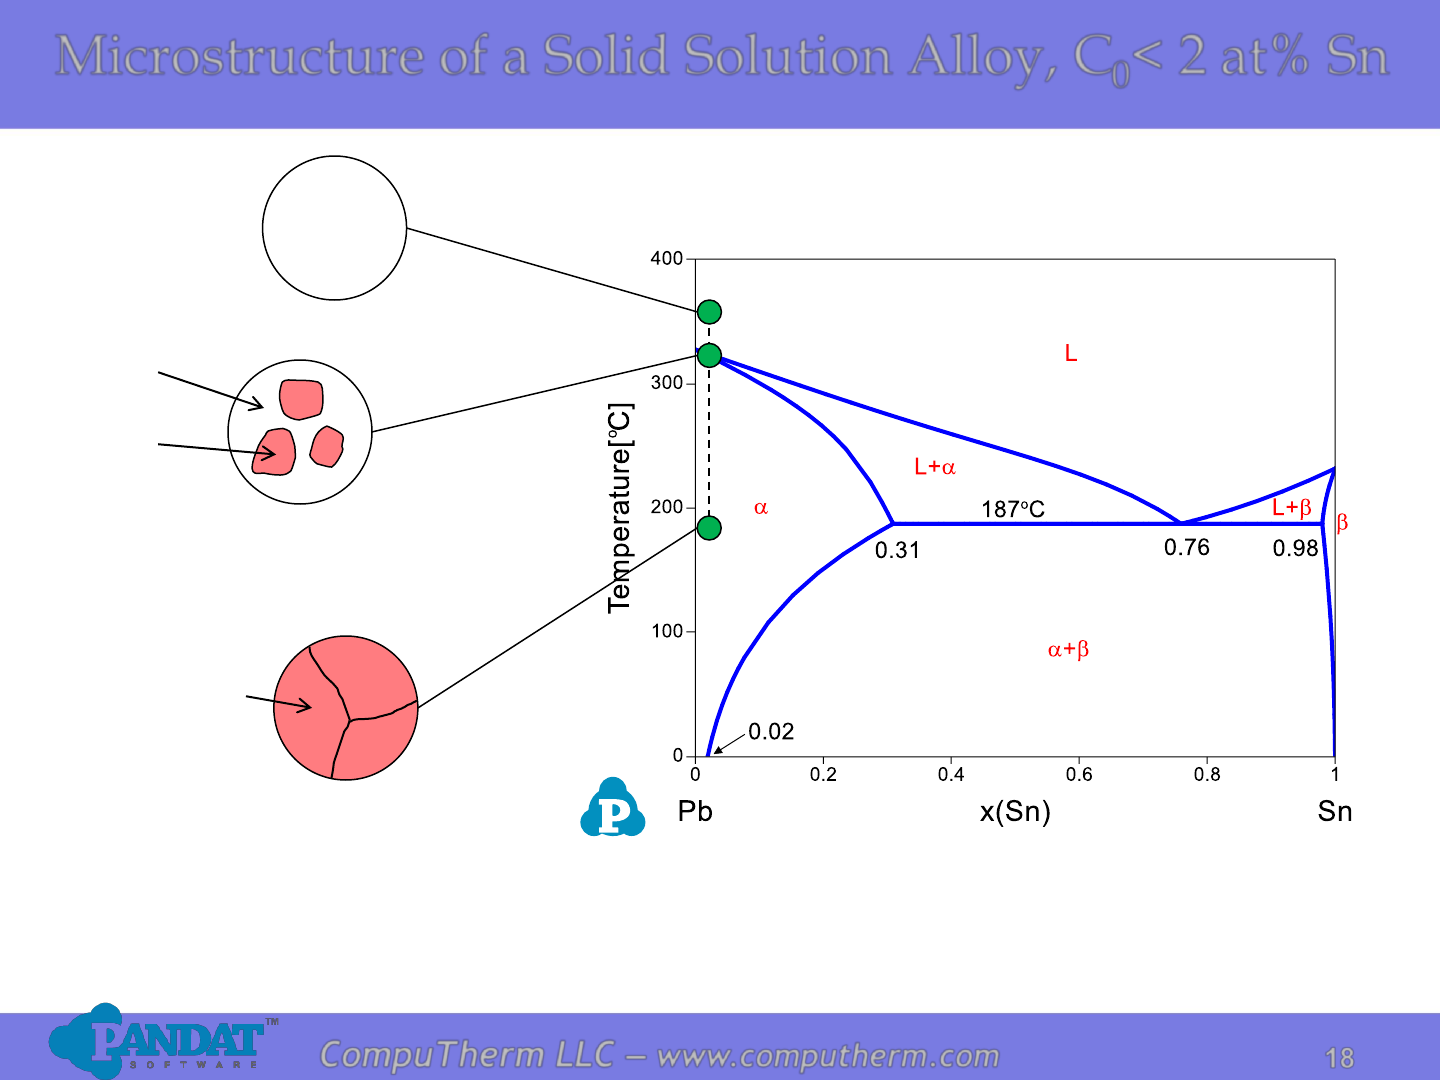
Microstructure of a Solid Solution Alloy, C
0
< 2 at% Sn
L
(C
0
)
L
a
a
(C
0
)
19
19
CompuTherm LLC – www.computherm.com
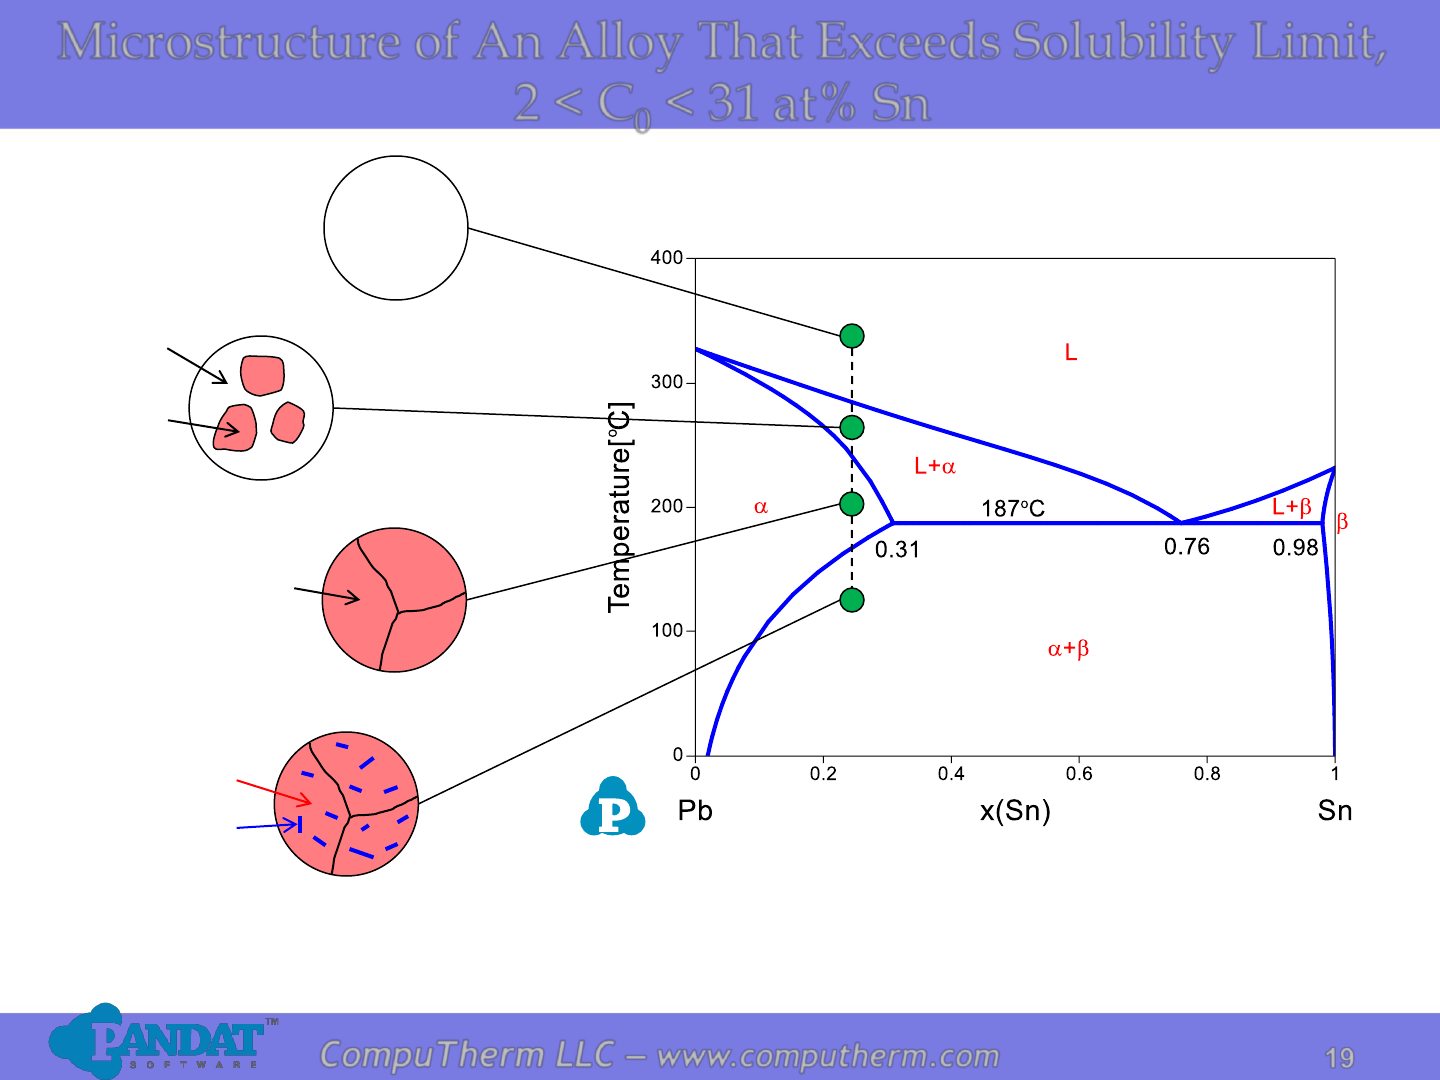
Microstructure of An Alloy That Exceeds Solubility Limit,
2 < C
0
< 31 at% Sn
L
(C
0
)
L
a
a
(C
0
)
a
20
20
CompuTherm LLC – www.computherm.com
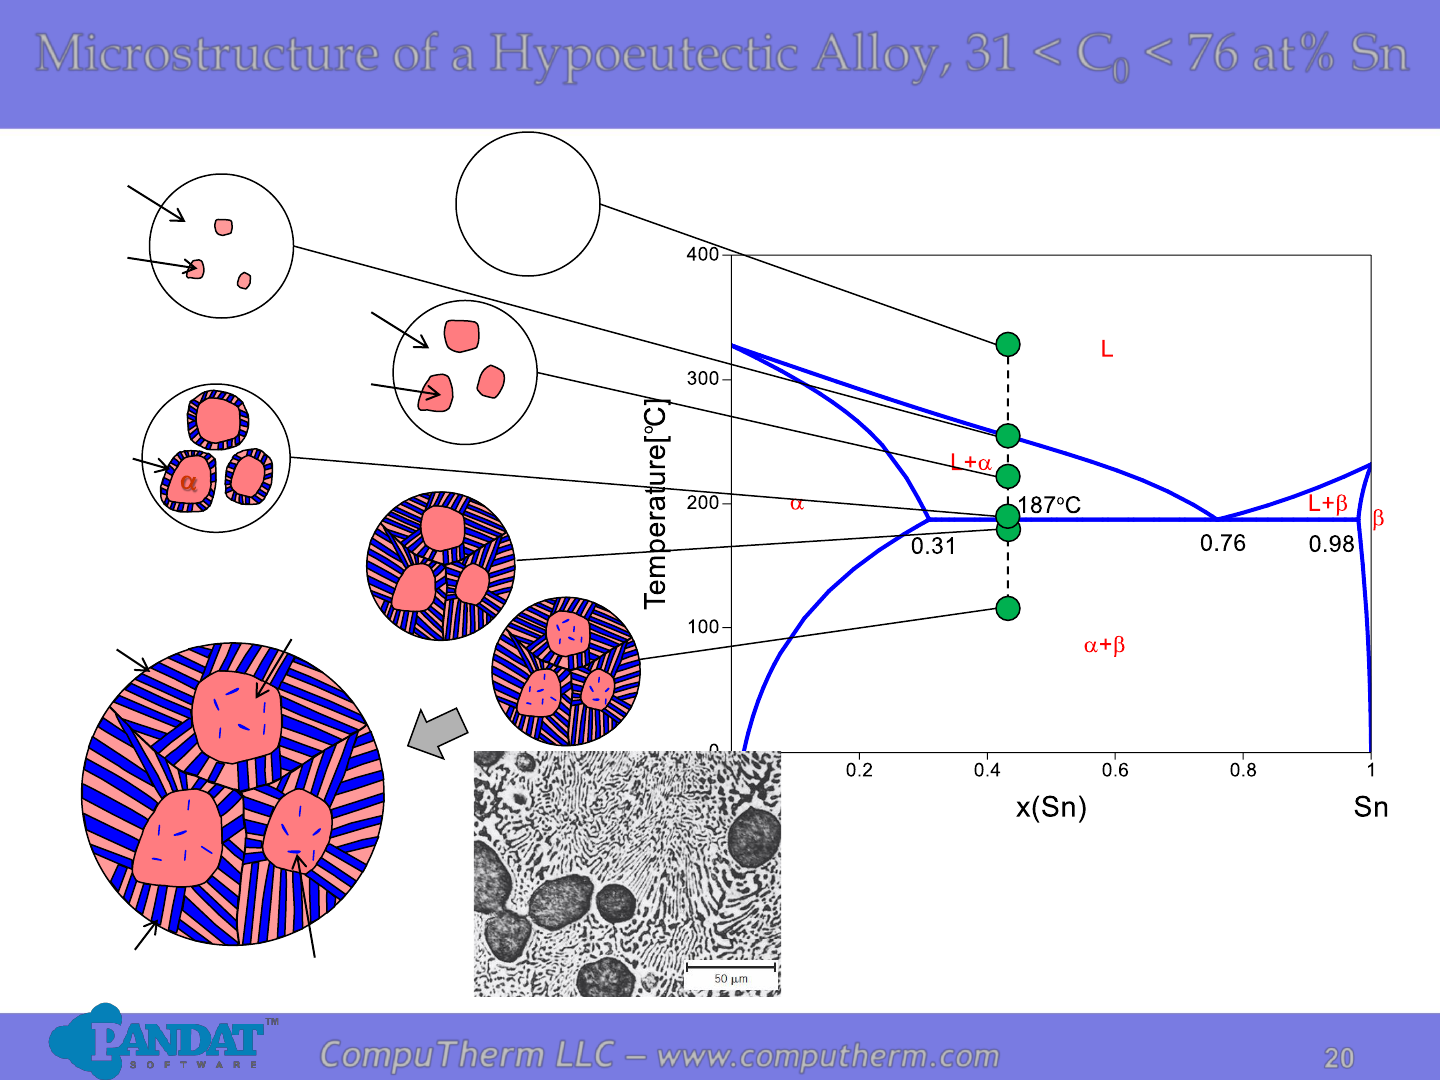
Microstructure of a Hypoeutectic Alloy, 31 < C
0
< 76 at% Sn
L
L
a
L
a
L
Primary a
Eutectic a
Eutectic
Precipitate
The dark layers are Pb-rich α phase,
and the light layers are Sn-rich β phase.
Photo copyright by Metals
Handbook Vol. 9, 1985.
21
21
CompuTherm LLC – www.computherm.com
Scheil (Non-Equilibrium) Solidification Simulation
Assumptions for Scheil Simulation:
•Planar solid/liquid interface and negligible undercooling
•Local equilibrium at the solid/liquid interface
•Complete diffusion in liquid phase
•No diffusion in solid phase
•Density of liquid equals density of solid
In Reality:
•Planar/sphere/… S/L interface and considerable undercooling
•Large diffusion in liquid phase
•Limited diffusion in solid phase
•Density of liquid does not equal to density of solid
Scheil simulation is good for fast cooling of systems with small amount.
22
22
CompuTherm LLC – www.computherm.com
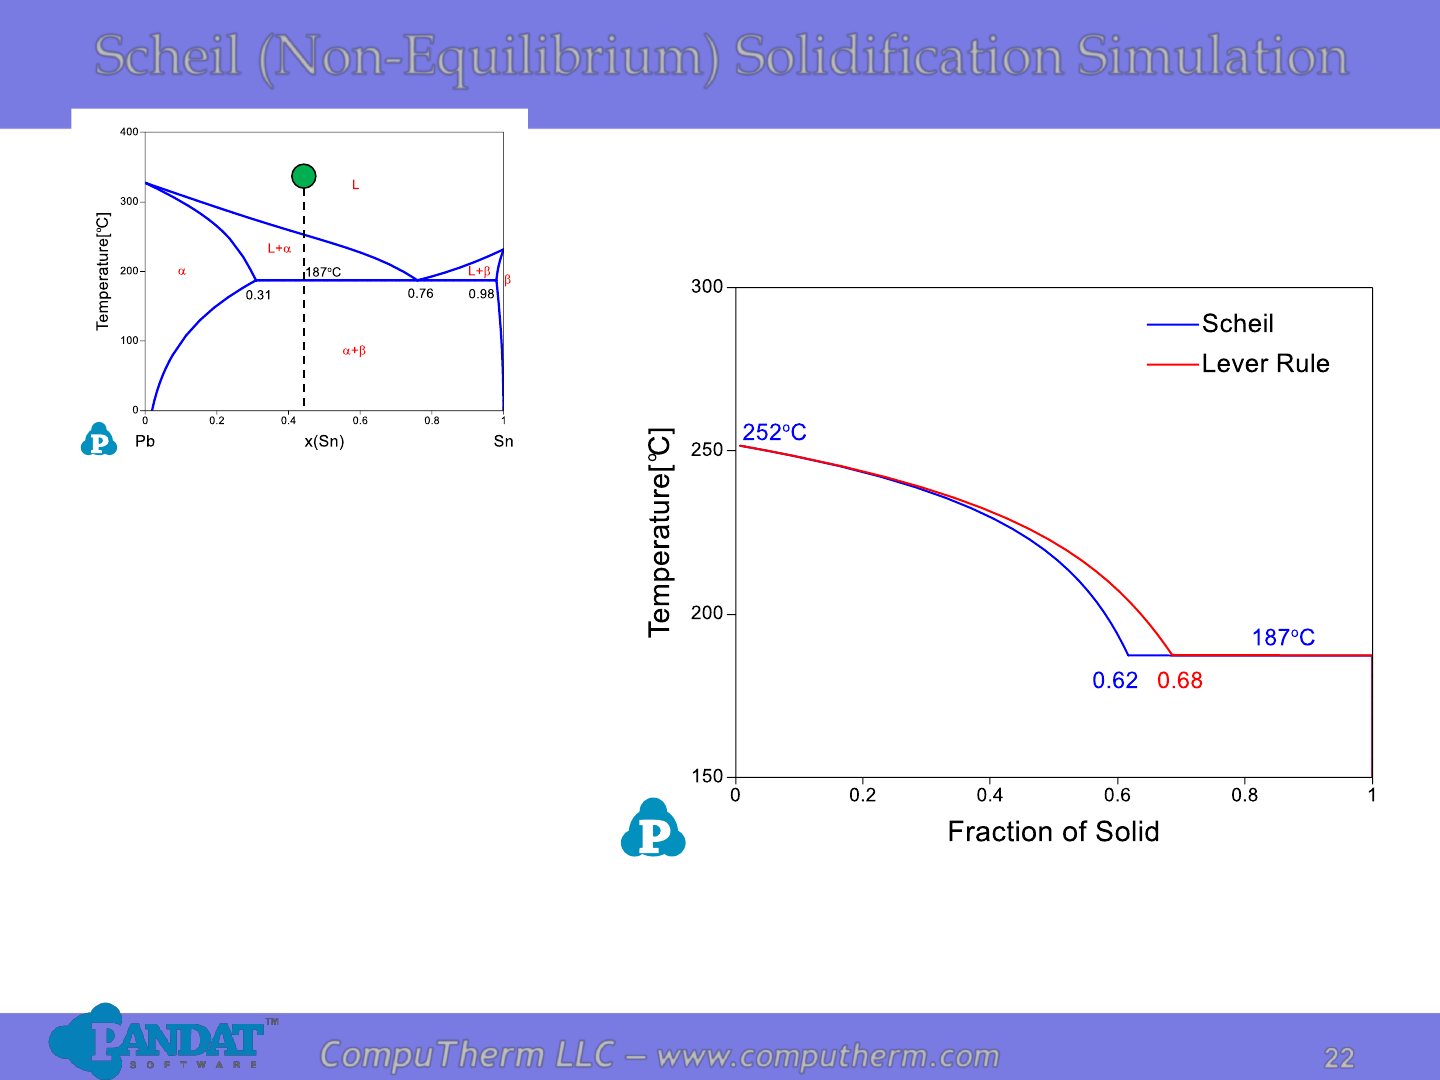
Scheil (Non-Equilibrium) Solidification Simulation
When the alloy hits the eutectic
temperature at 187
o
C, the liquid
transforms to a + mixture and
remains at the same temperature
until all the liquid is gone.
The final a phase fraction contains
two parts: primary a phase (~62%)
and eutectic a phase in the
eutectic mixture (~38%).
f(a) = 62%+38%*33% = 74%
f() = 38%*67% = 26%
For the Alloy Pb-45at%Sn, the
liquid starts to solidify at 252
o
C
and the a phase is the product.
23
23
CompuTherm LLC – www.computherm.com
Types of Binary Phase Diagrams
• Isomorphous Systems
• Eutectic Systems
• Eutectoid Systems
• Peritectic Systems
• Peritectoid Systems
• Monotectic Systems
• Syntectic Systems
24
24
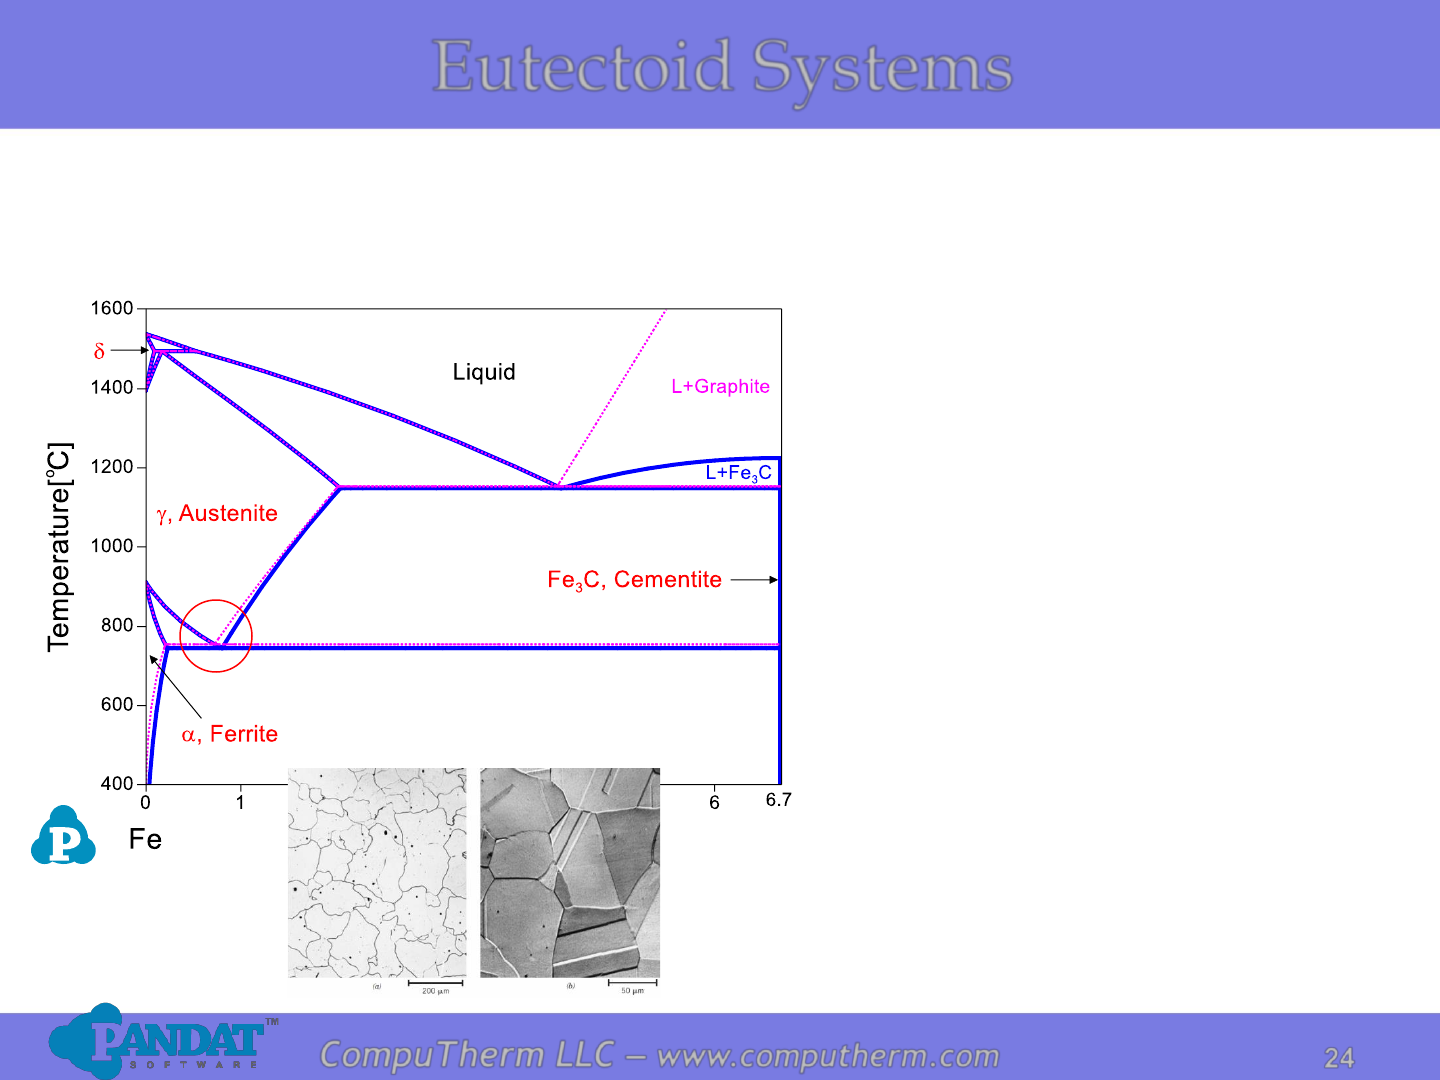
CompuTherm LLC – www.computherm.com
Eutectoid Systems
Information from this diagram:
• Fe-C stable phase boundaries
are represented by pink dot
lines, and Fe-Fe
3
C metastable
phase boundaries are
represented by blue solid lines.
• Fe
3
C phase is a line compound
(6.7 wt% of Carbon) without
any solubility.
• Carbon is an interstitial
impurity in iron and forms a
solid solution with the a, g, d
phases.
• Eutectoid reaction is a solid
state reaction with no liquid
involved: g ↔ a + Fe
3
C.
Photo copyright by United States Steel Corporation.
a, Ferrite
g, Austenite
25
25
CompuTherm LLC – www.computherm.com
Formation of Pearlite
Due to the eutectoid reaction: g ↔ a + Fe
3
C, pearlite structure is formed.
Pearlite: alternating layers of a and Fe
3
C phases, not a single phase.
Growth
direction of
pearlite
Austenite
(g)
Austenite
(g)
Cementite
(Fe
3
C)
Ferrite(a)
Ferrite(a)
Ferrite(a)
Ferrite(a)
a
a
Carbon
diffusion
Austenite
grain
boundary
g
g
g
a
Fe
3
C
• Nucleating at g grain boundaries.
• Growth by diffusion of carbon to achieve the compositions of a and Fe
3
C
(with structure changes).
• According to lever rule, the amount of a is much larger than that of Fe
3
C,
resulting in a much thicker a lamellae.
Photo copyright by Metals Handbook Vol. 9, 1985.
26
26
CompuTherm LLC – www.computherm.com
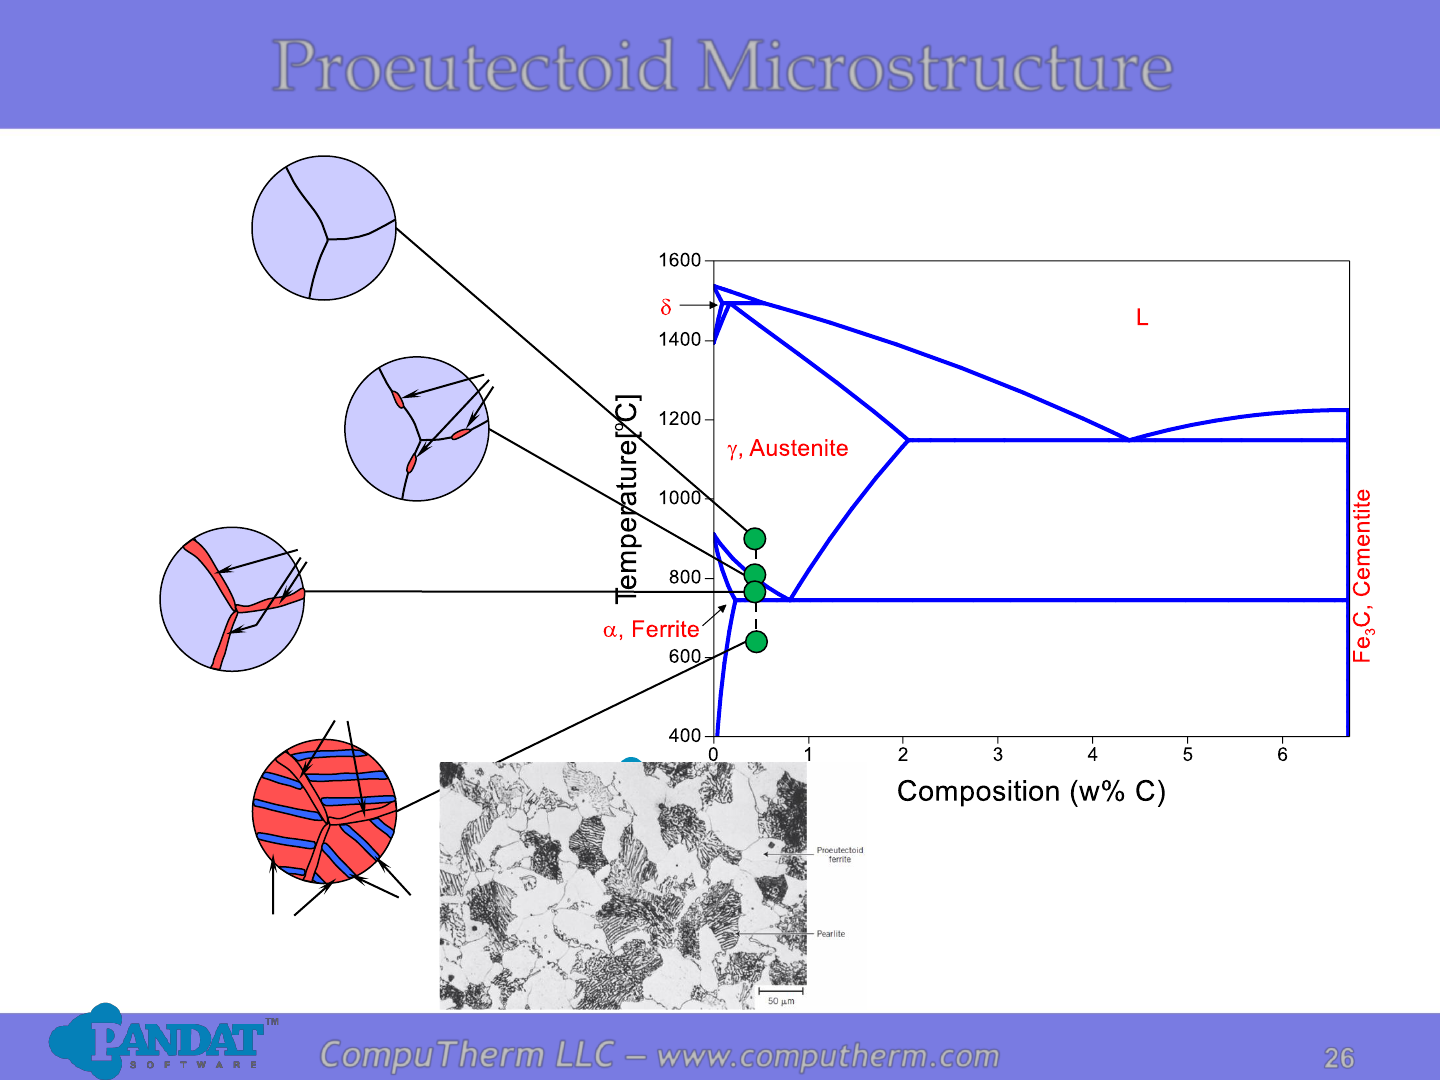
g
g
g
g
g
g
a
g
g
g
a
Proeutectoid a
Eutectoid a
Fe
3
C
Proeutectoid Microstructure
Photo copyright by Republic Steel Corporation.
27
27
CompuTherm LLC – www.computherm.com
g
g
g
g
g
g
Fe
3
C
g
g
g
Fe
3
C
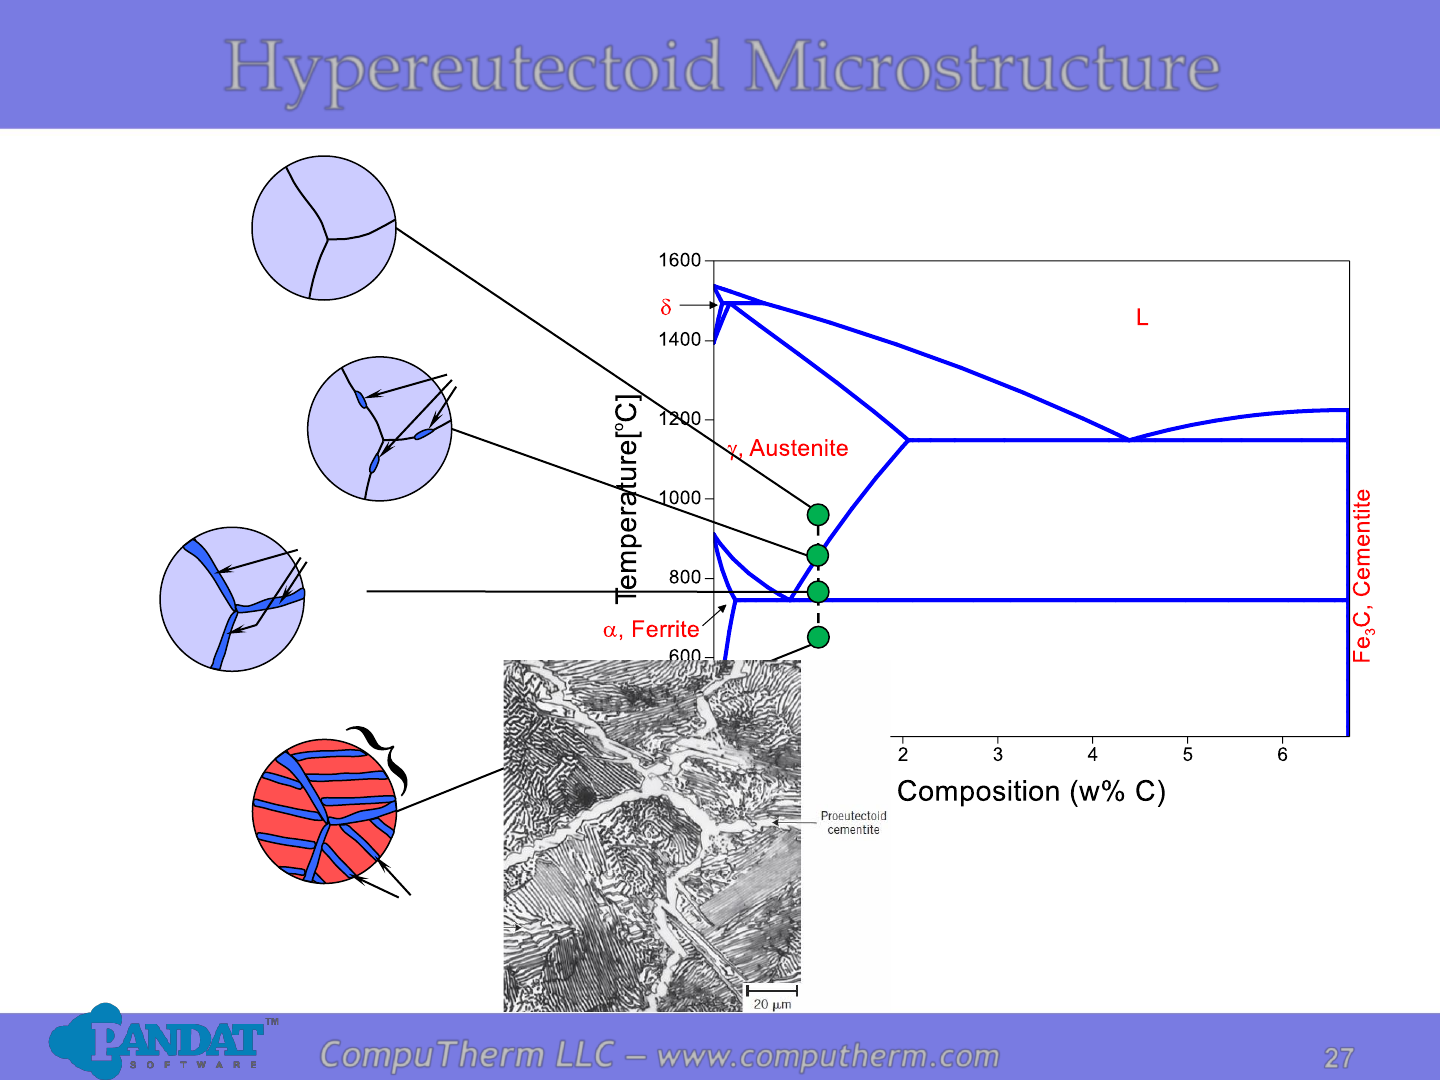
Hypereutectoid Microstructure
Fe
3
C
Pearlite
Photo copyright by United States Steel Corporation.

28
28
CompuTherm LLC – www.computherm.com
Types of Binary Phase Diagrams
• Isomorphous Systems
• Eutectic Systems
• Eutectoid Systems
• Peritectic Systems
• Peritectoid Systems
• Monotectic Systems
• Syntectic Systems
29
29
CompuTherm LLC – www.computherm.com
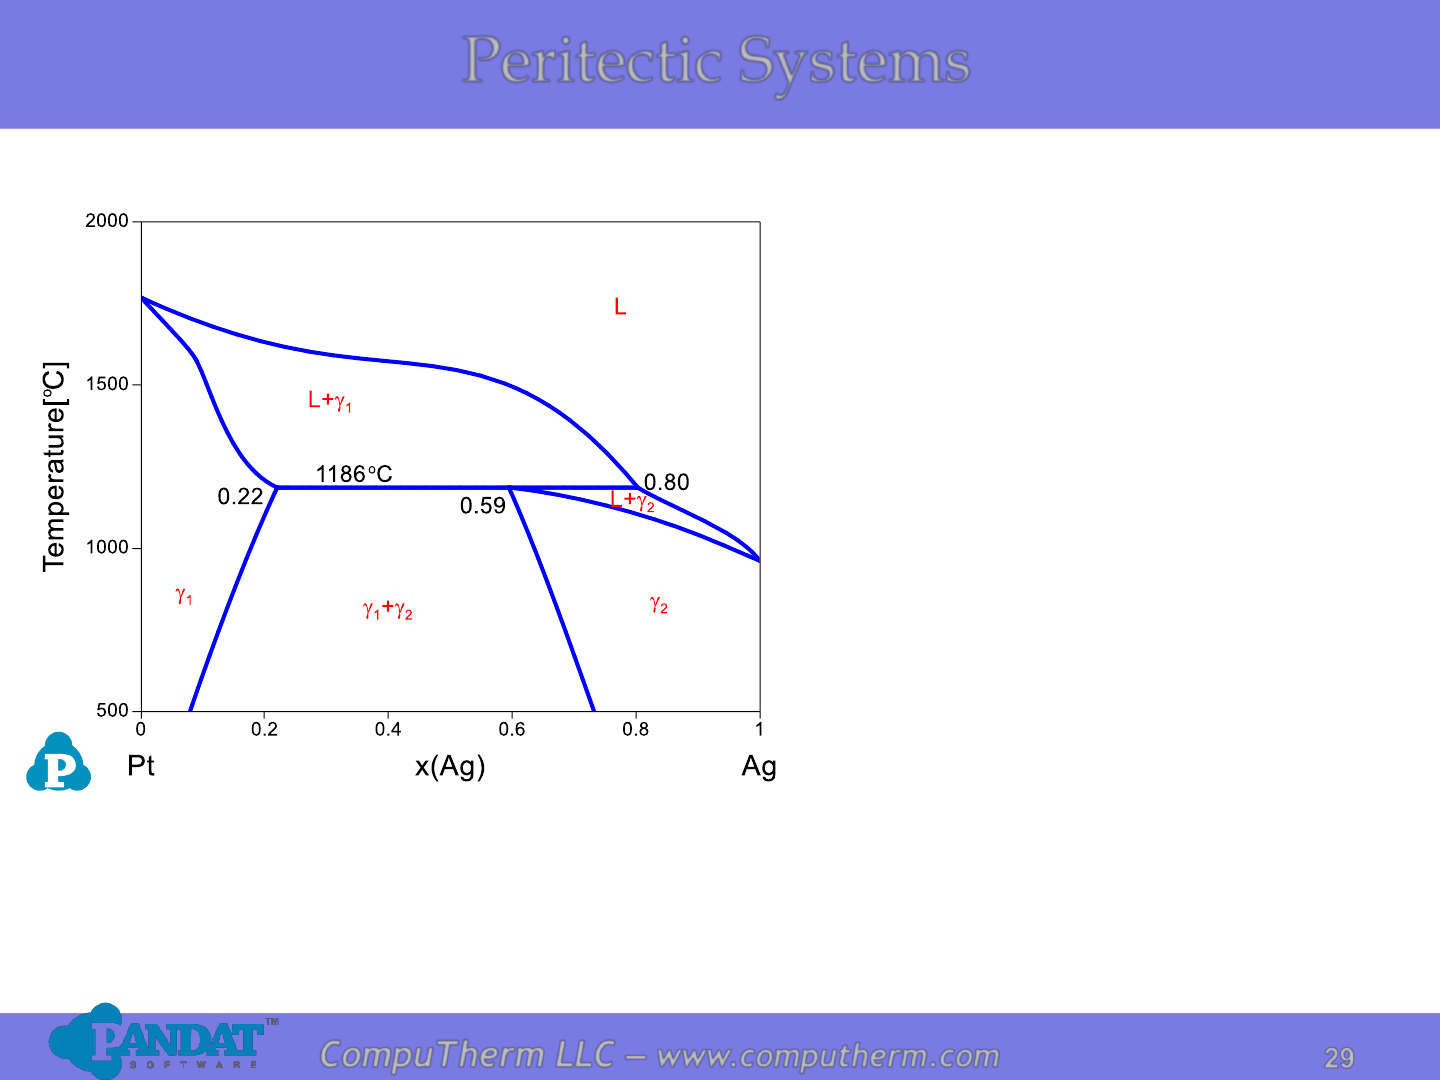
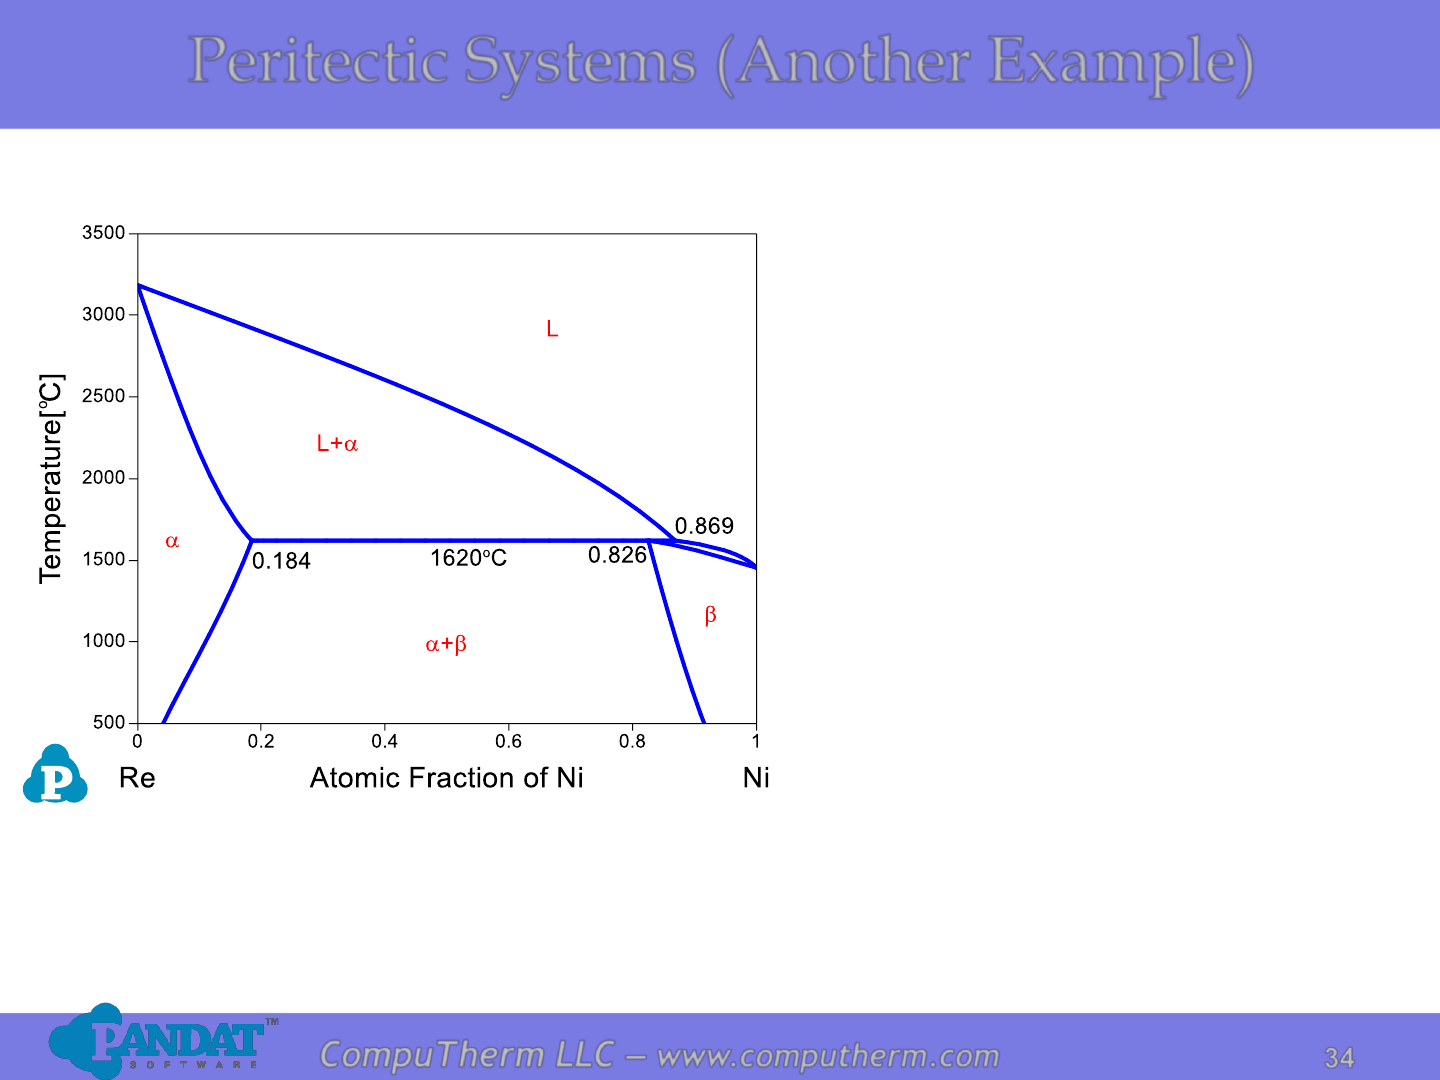
Peritectic Systems
Information from this diagram:
• Peritectic reaction occurs at
1186
o
C and 80 at% Ag:
L + g
1
↔ g
2
.
• Alloy (22%<x
Ag
<59%) starts to
melt at peritectic reaction
temperature 1186
o
C and
becomes complete liquid at
liquidus.
• Alloy (x
Ag
<22% or x
Ag
>59%)
starts to melt at solidus, and
becomes complete liquid at
liquidus.
Details Refer to:
1. Database: Database_Peritectic_Ag-Pt.tdb
2. Tutorial Video: Binary_Peritectic
30
30
CompuTherm LLC – www.computherm.com
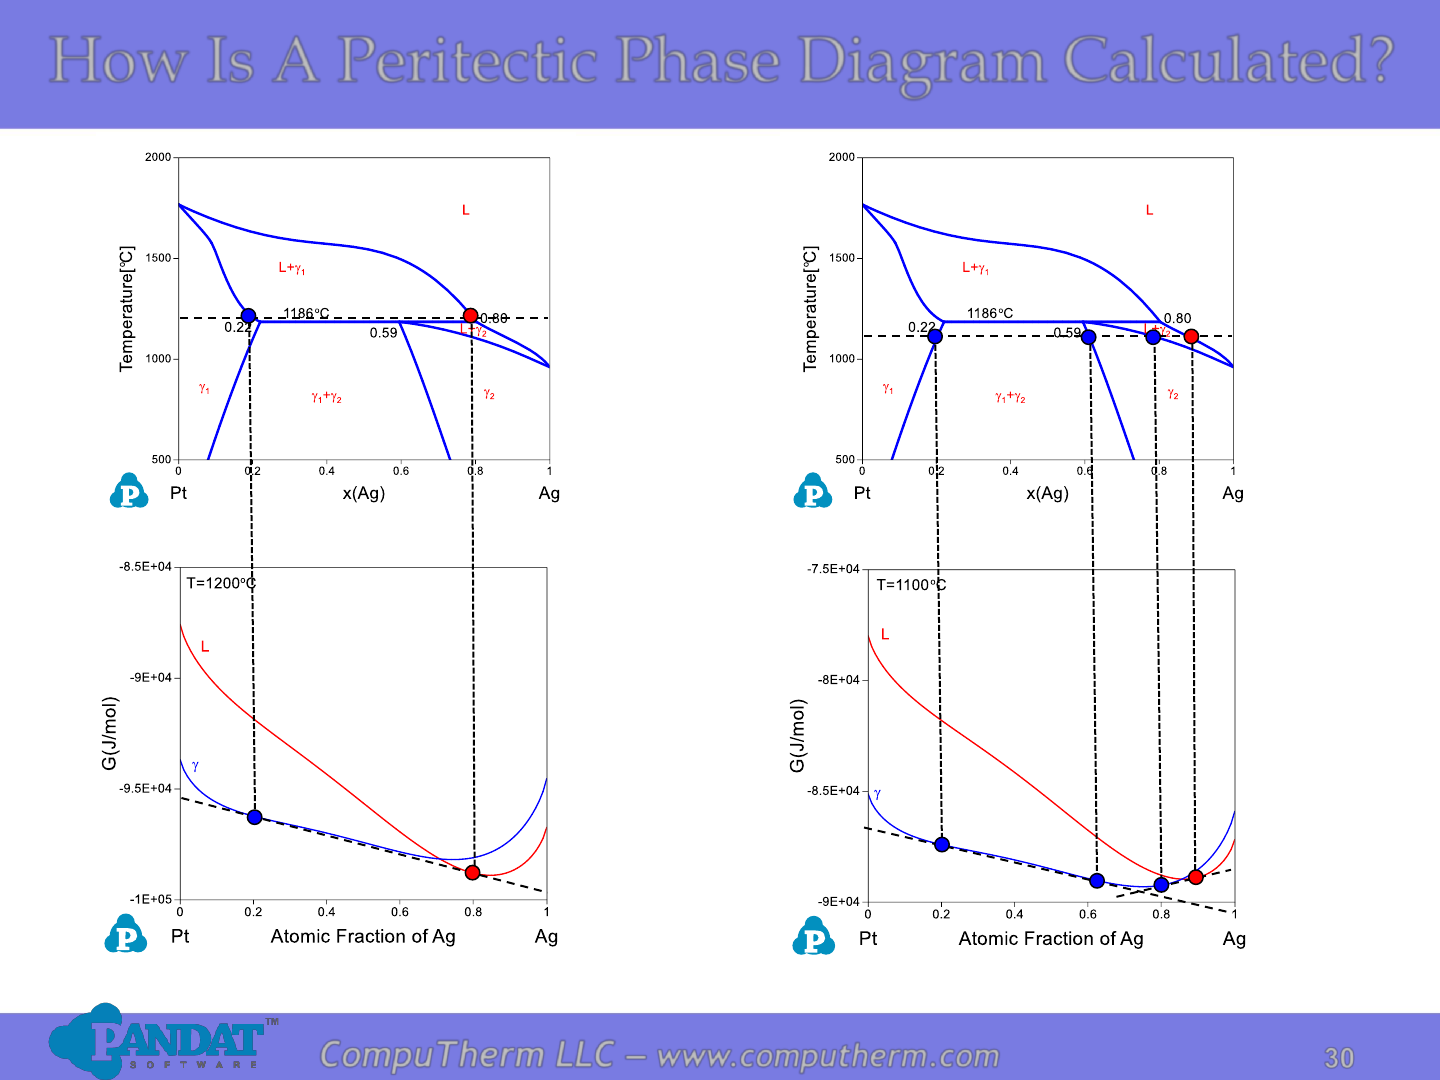
How Is A Peritectic Phase Diagram Calculated?
31
31
CompuTherm LLC – www.computherm.com
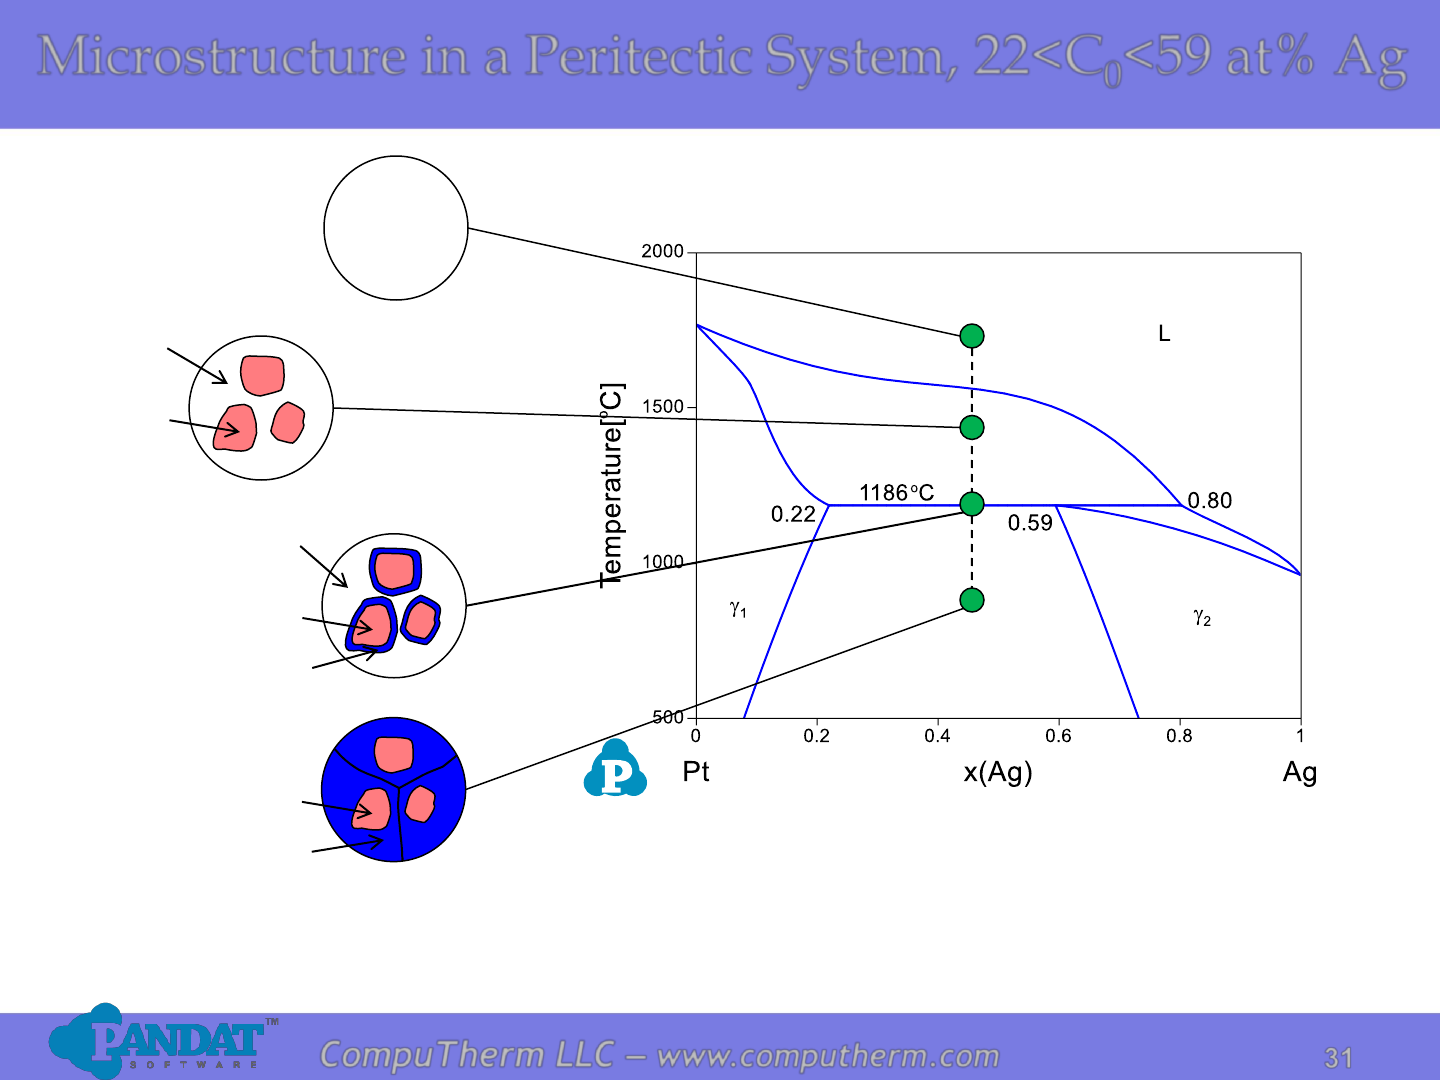
Microstructure in a Peritectic System, 22<C
0
<59 at% Ag
L
L
g
1
g
1
g
2
L
g
1
g
2
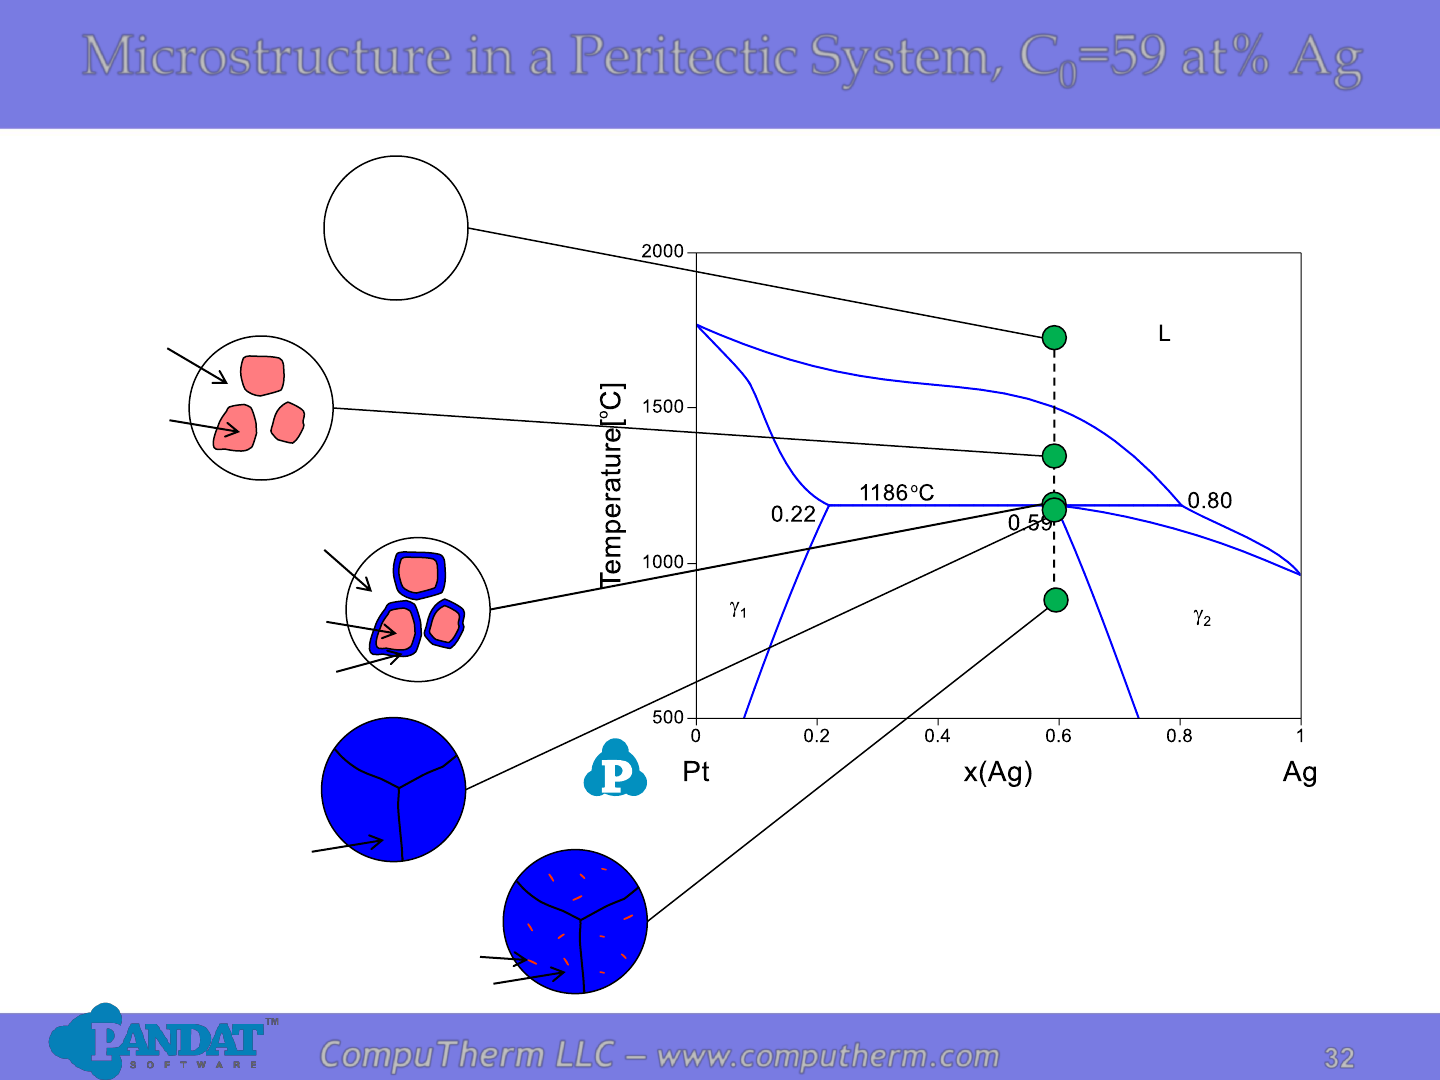
32
32
CompuTherm LLC – www.computherm.com
Microstructure in a Peritectic System, C
0
=59 at% Ag
L
L
g
1
L
g
1
g
2
g
2
g
2
Precipitate g
1
33
33
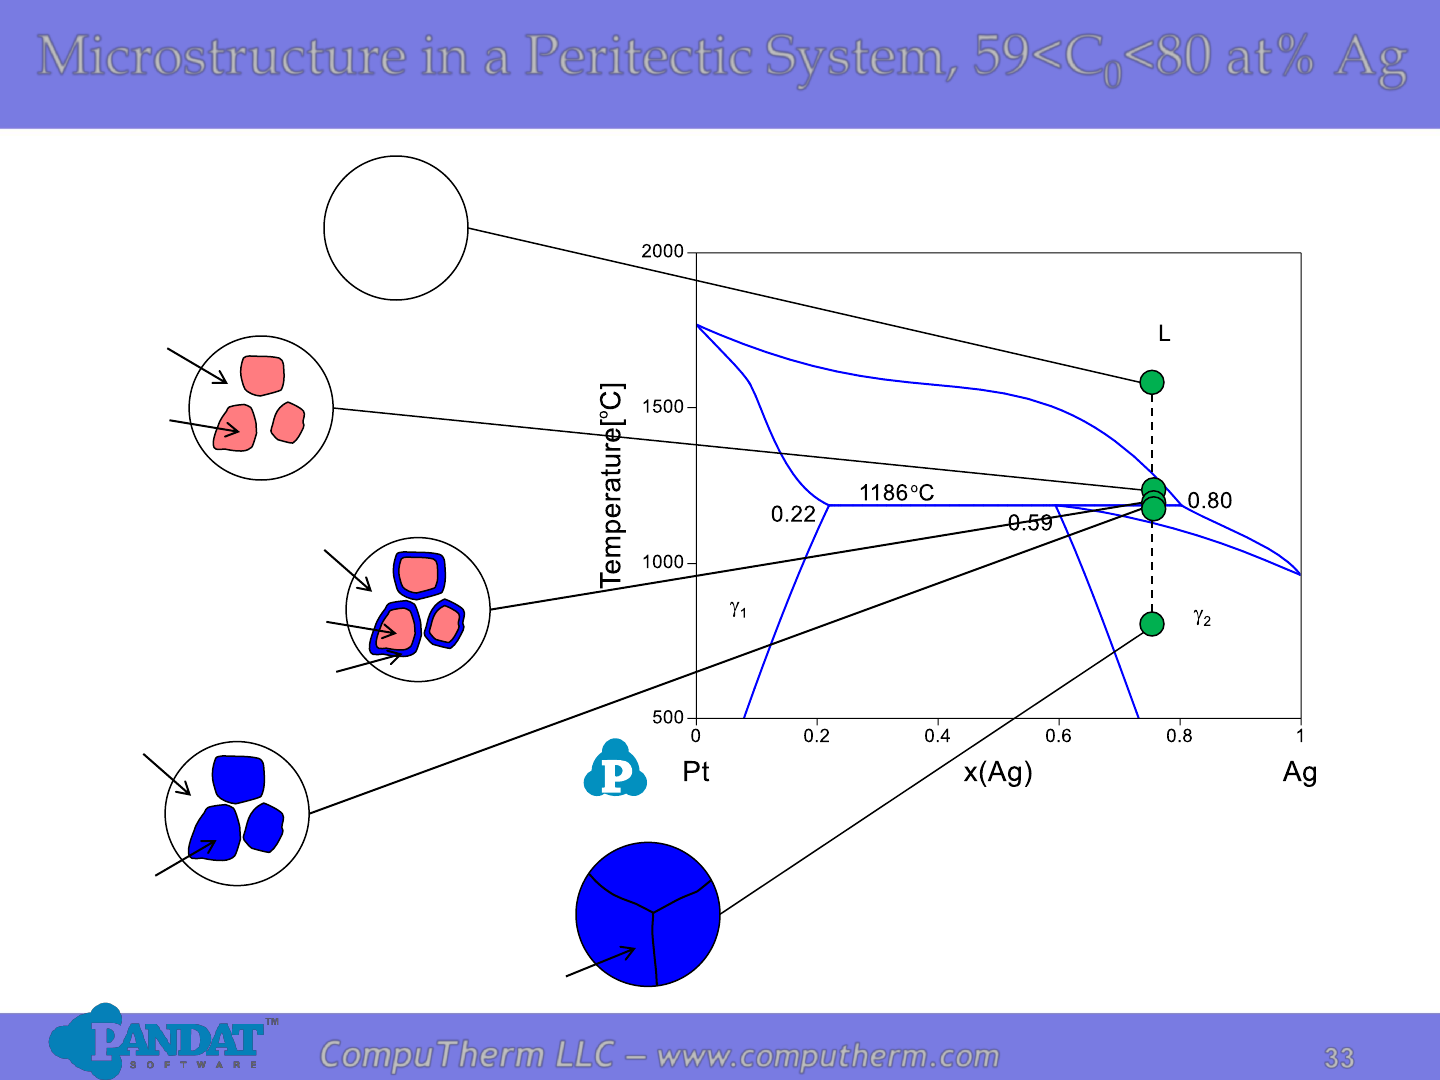
CompuTherm LLC – www.computherm.com
Microstructure in a Peritectic System, 59<C
0
<80 at% Ag
L
L
g
1
L
g
1
g
2
g
2
L
g
2
34
34
CompuTherm LLC – www.computherm.com
Peritectic Systems (Another Example)
Information from this diagram:
• Peritectic reaction occurs at
1620
o
C and 86.9 at% Ni:
L + a ↔ .
• Alloy (18.4%<x
Ni
<82.6%) starts
to melt at peritectic reaction
temperature 1620
o
C and
becomes complete liquid at
liquidus.
• Alloy (x
Ni
<18.4% or x
Ni
>86.9%)
starts to melt at solidus, and
becomes complete liquid at
liquidus.
Details Refer to:
1. Database: Database_Peritectic_Ni-Re.tdb
2. Tutorial Video: Binary_Peritectic
35
35
CompuTherm LLC – www.computherm.com
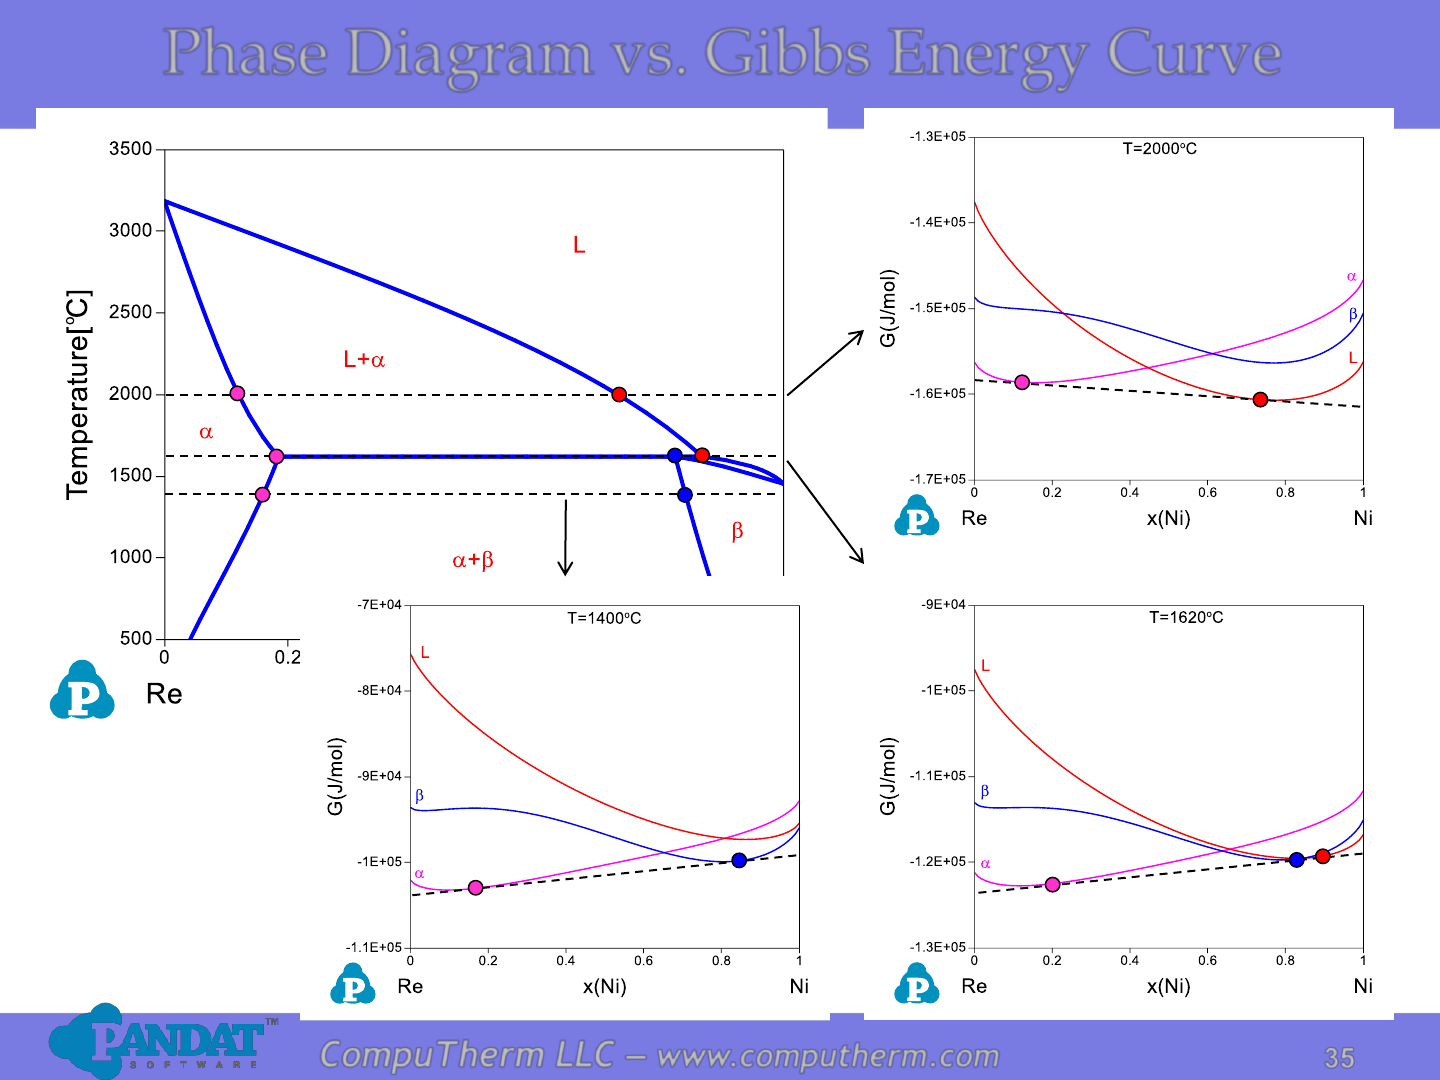
Phase Diagram vs. Gibbs Energy Curve
36
36
CompuTherm LLC – www.computherm.com
Types of Binary Phase Diagrams
• Isomorphous Systems
• Eutectic Systems
• Eutectoid Systems
• Peritectic Systems
• Peritectoid Systems
• Monotectic Systems
• Syntectic Systems
37
37
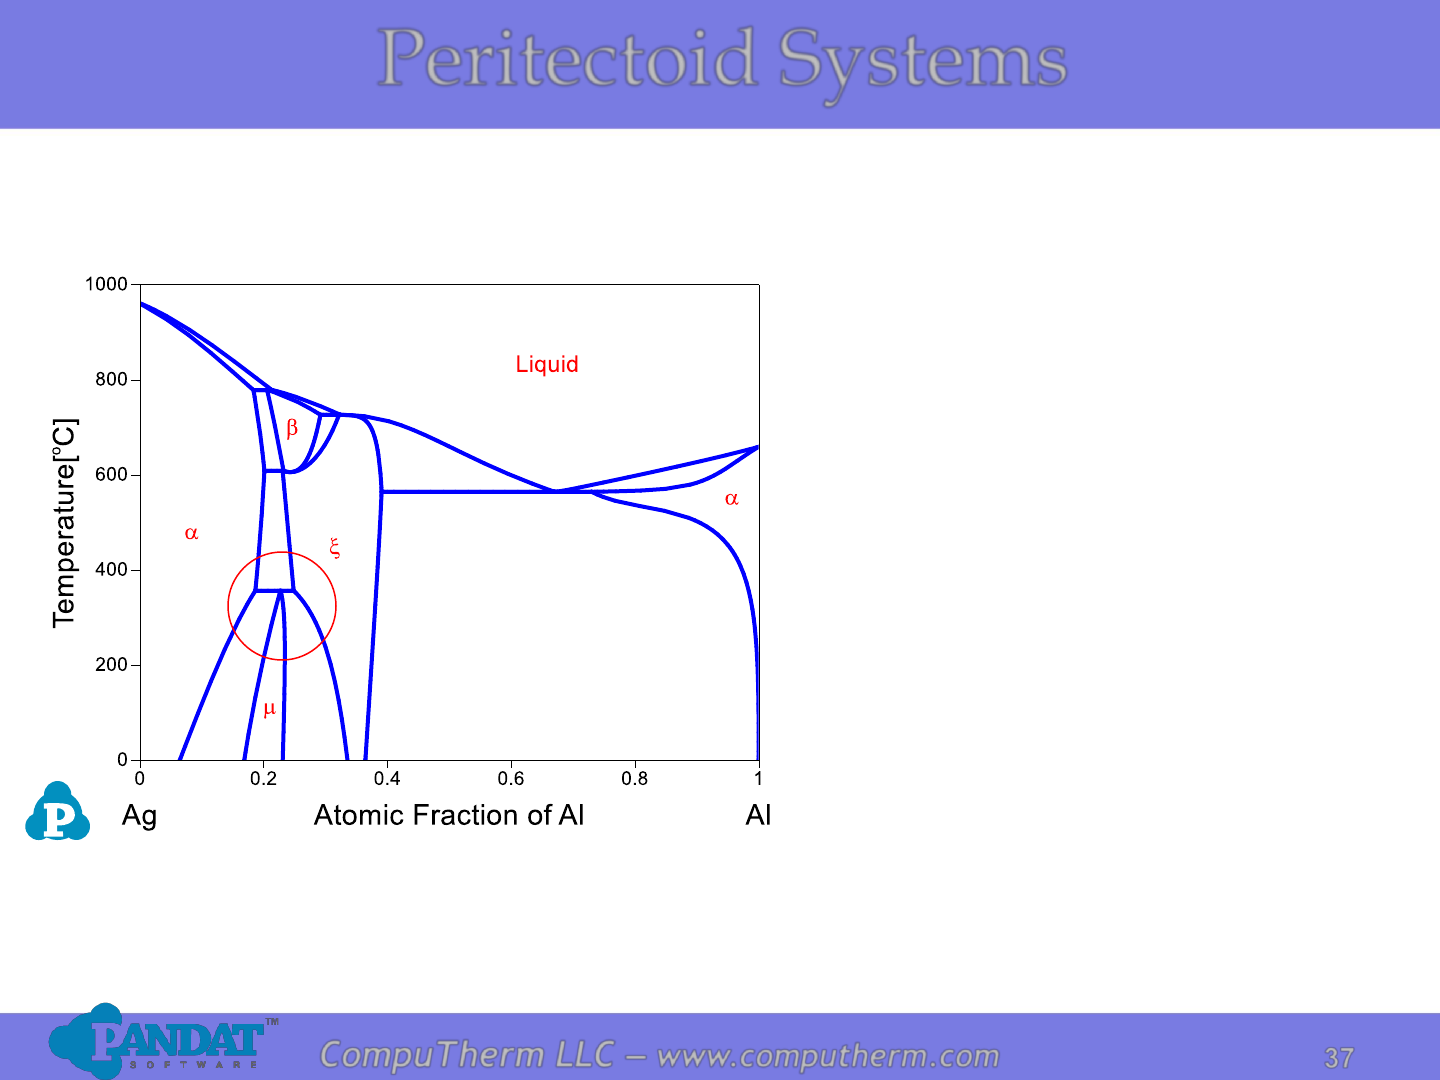
CompuTherm LLC – www.computherm.com
Information from this diagram:
• Peritectoid reaction is a solid
state reaction without any
liquid involved.
• Peritectoid reaction occurs at
358
o
C and 18.6 - 24.8 at% Al:
a + x ↔ m.
Peritectoid Systems
Details Refer to:
1. Database: Database_Peritectoid_Ag-Al.tdb
2. Tutorial Video: Binary_Peritectoid
38
38
CompuTherm LLC – www.computherm.com
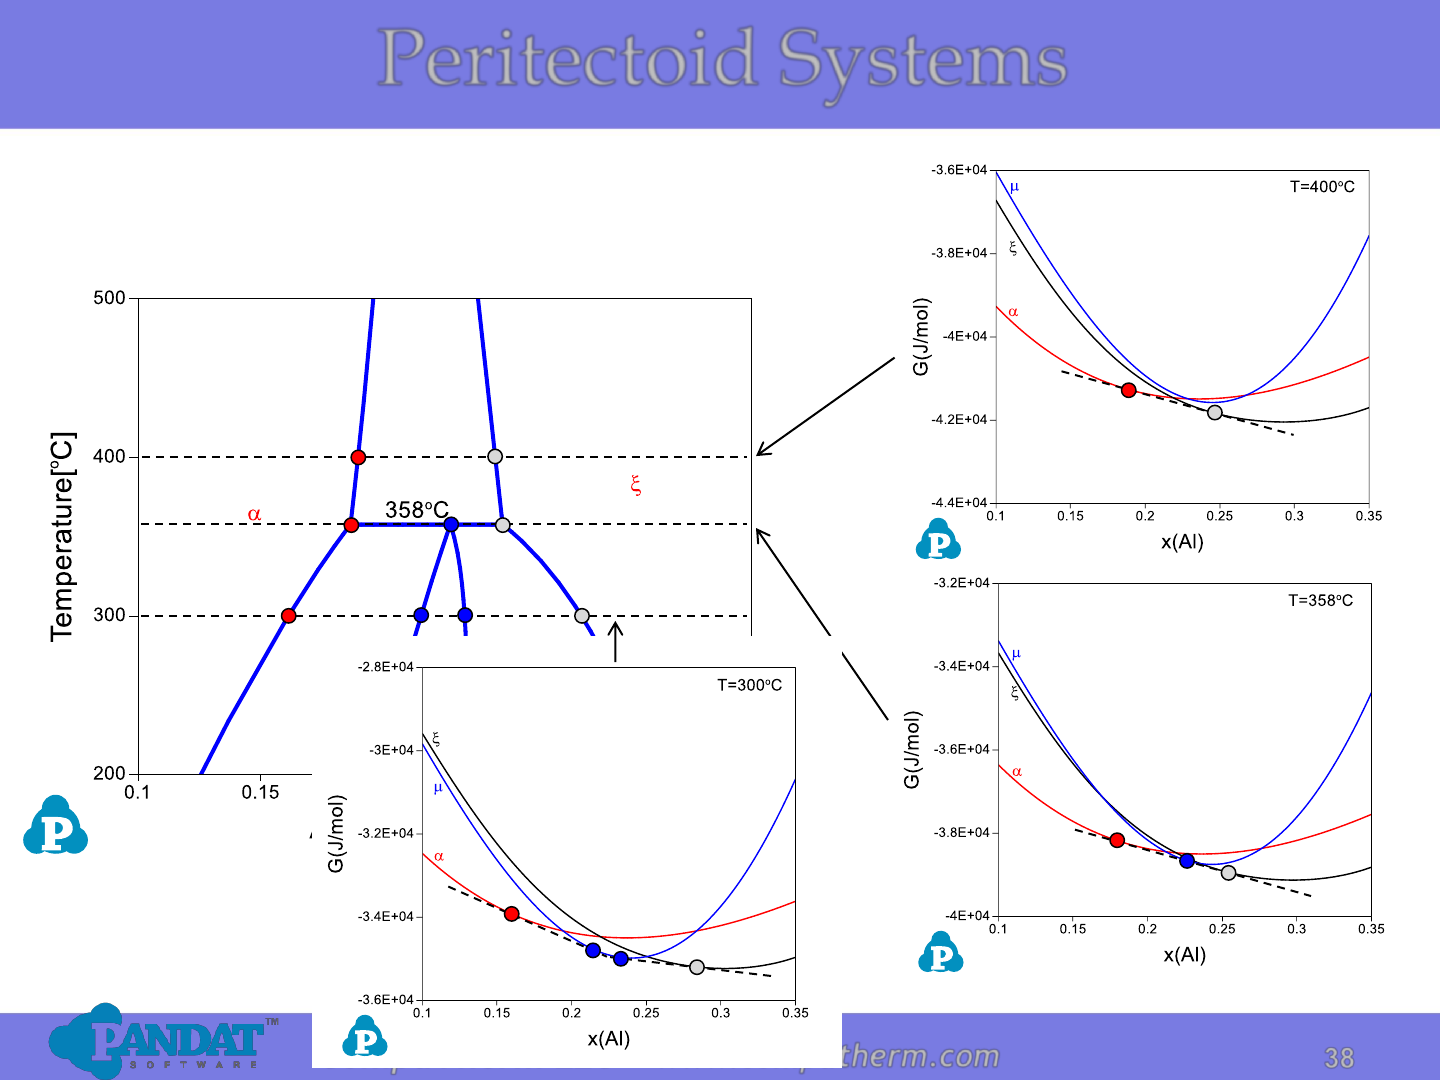
Peritectoid Systems
39
39
CompuTherm LLC – www.computherm.com
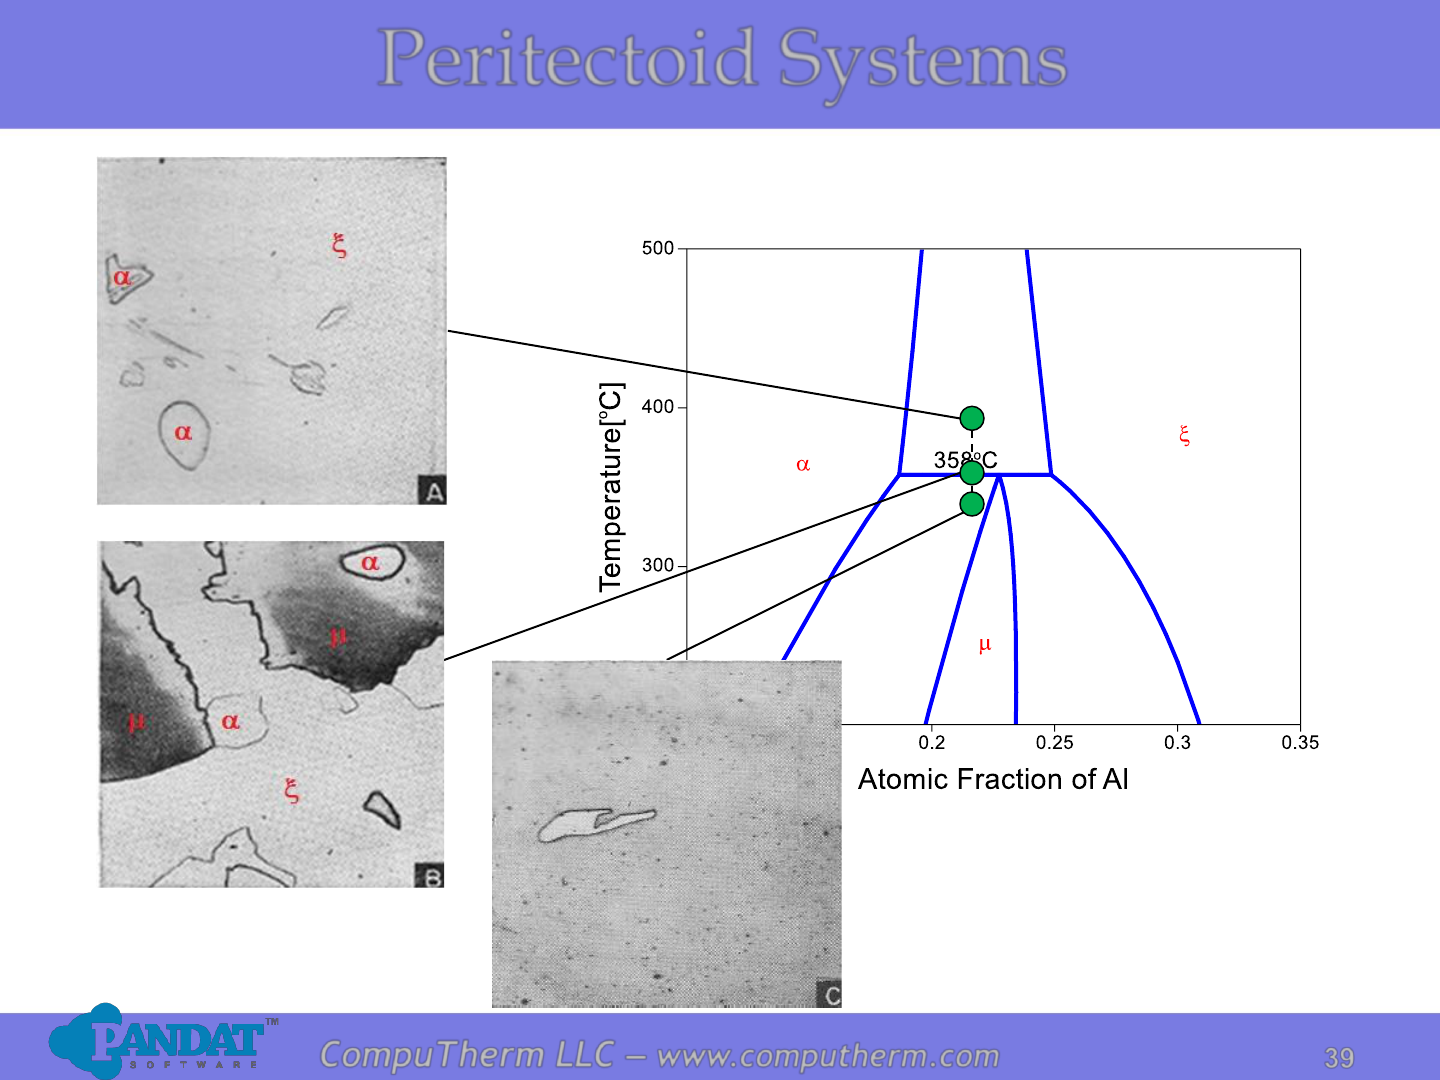
Peritectoid Systems
Photos from Phase Diagrams in Metallurgy, F.N. Rhines.
a
m

40
40
CompuTherm LLC – www.computherm.com
Types of Binary Phase Diagrams
• Isomorphous Systems
• Eutectic Systems
• Eutectoid Systems
• Peritectic Systems
• Peritectoid Systems
• Monotectic Systems
• Syntectic Systems
41
41
CompuTherm LLC – www.computherm.com
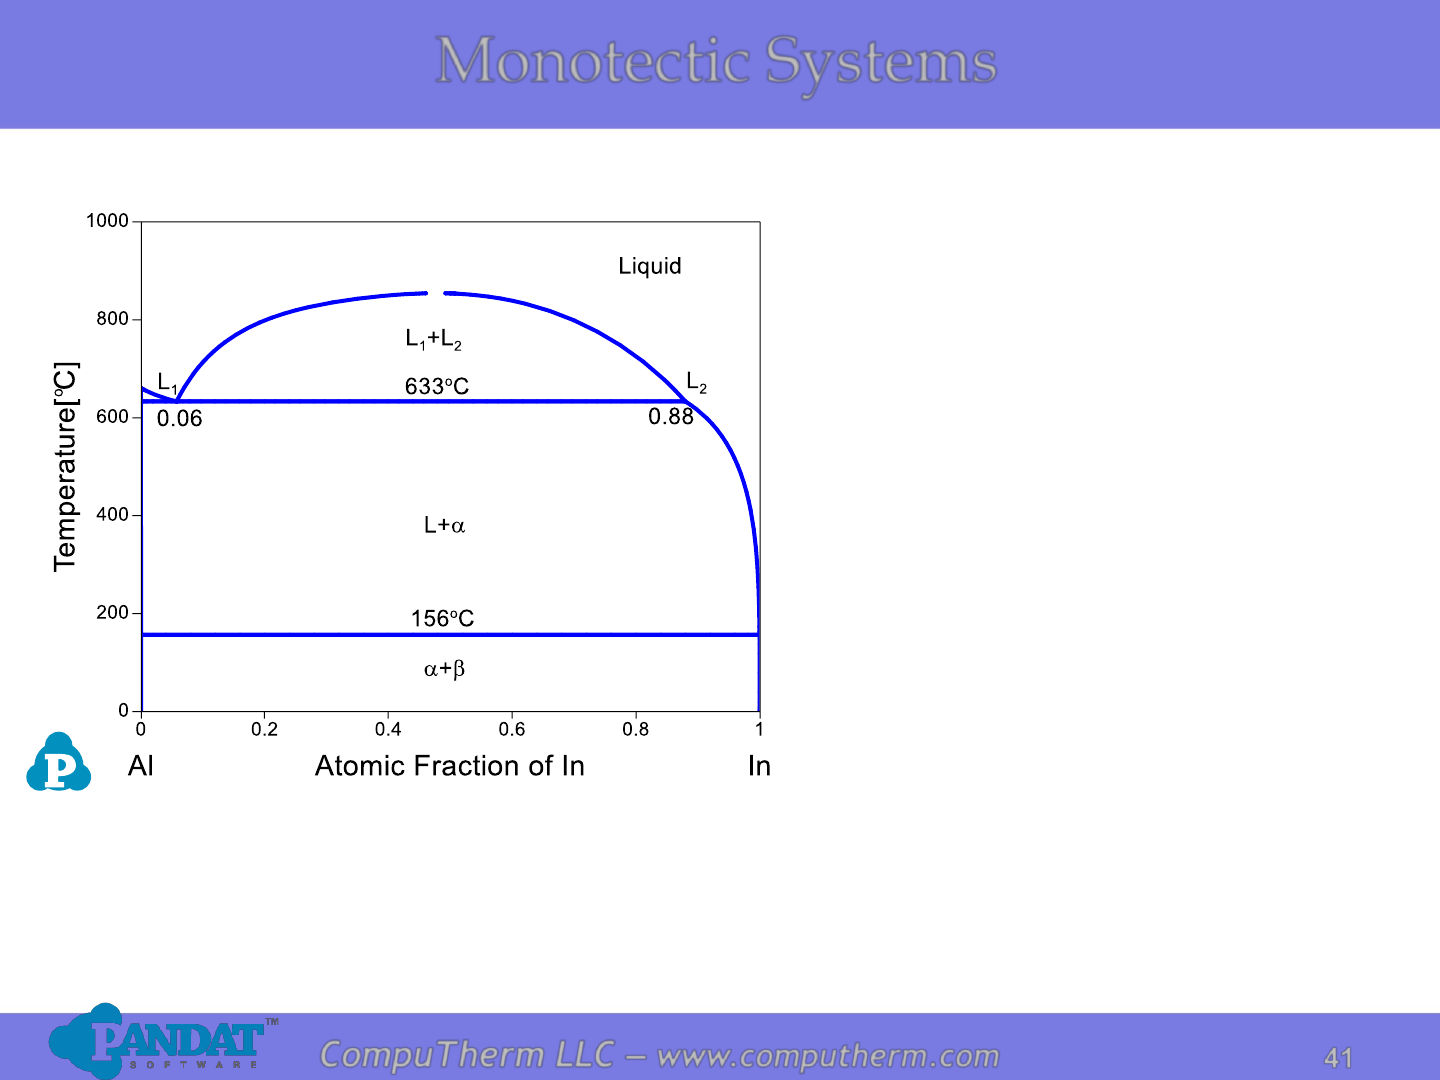
Monotectic Systems
Information from this diagram:
• Monotectic reaction occurs at
663
o
C and 6 at% In:
L
1
↔ a + L
2
.
• Alloys of all compositions start
to melt at eutectic temperature
156
o
C: L ↔ a + .
• Alloy (x
In
<6at% or x
In
>88at%)
becomes complete liquid at
liquidus.
• Alloy (6at%<x
In
<88at%)
becomes complete liquid
mixture (two liquids with
different compositions) at
663
o
C.
Details Refer to:
1. Database: Database_Monotectic_Al-In.tdb
2. Tutorial Video: Binary_Monotectic
42
42
CompuTherm LLC – www.computherm.com
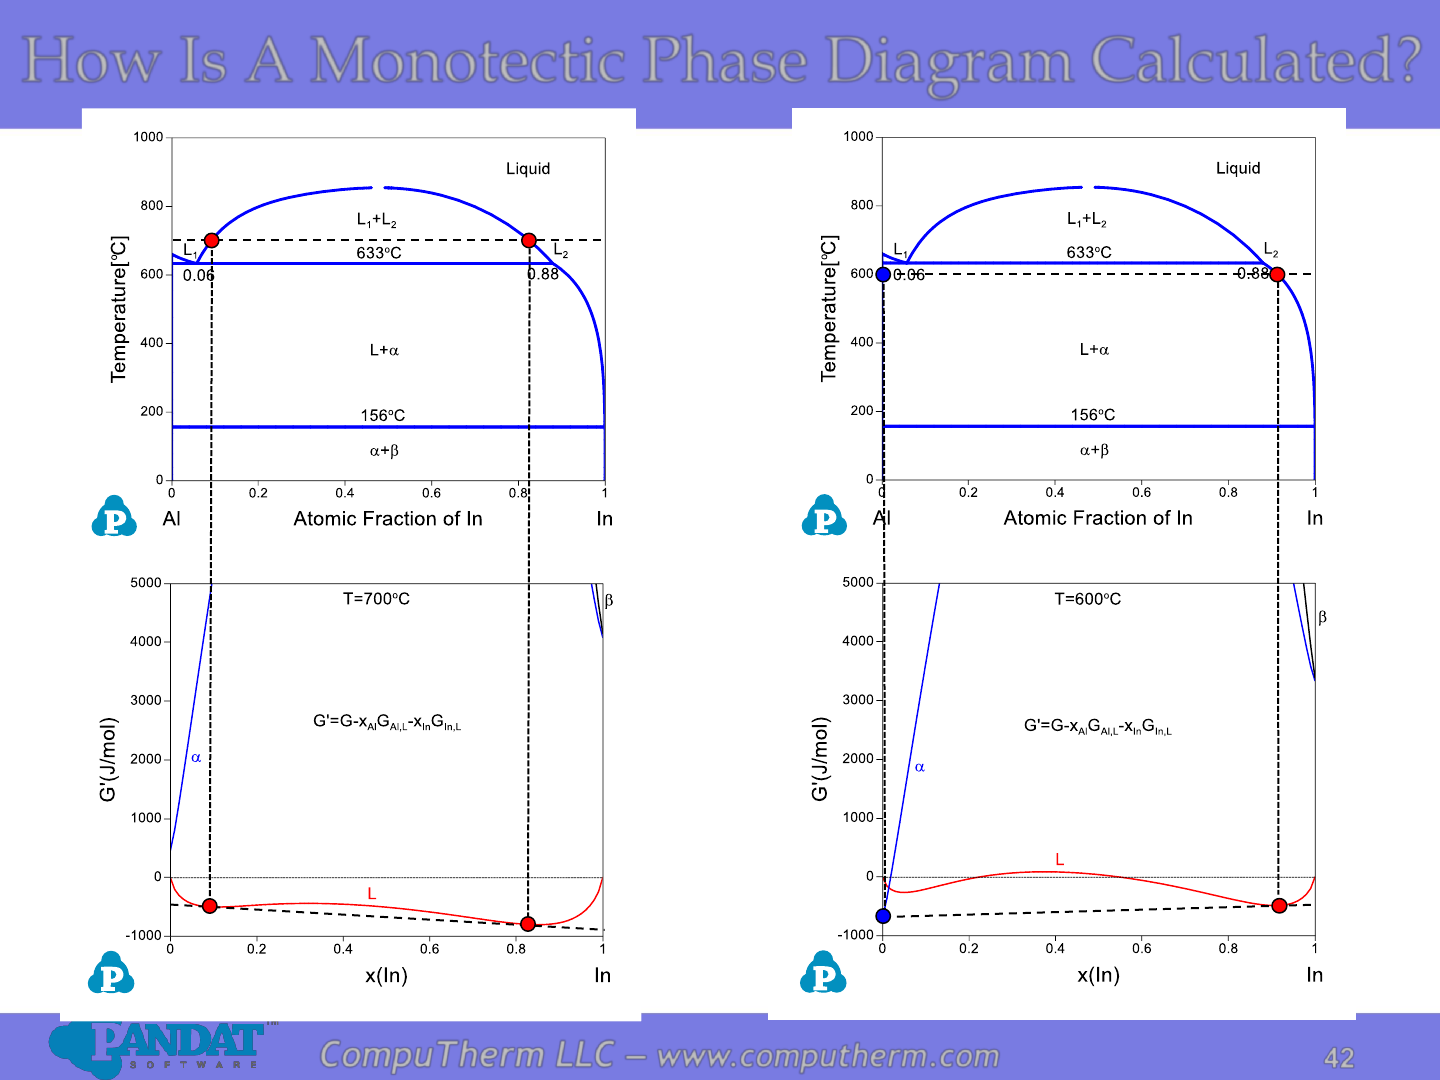
How Is A Monotectic Phase Diagram Calculated?
43
43
CompuTherm LLC – www.computherm.com
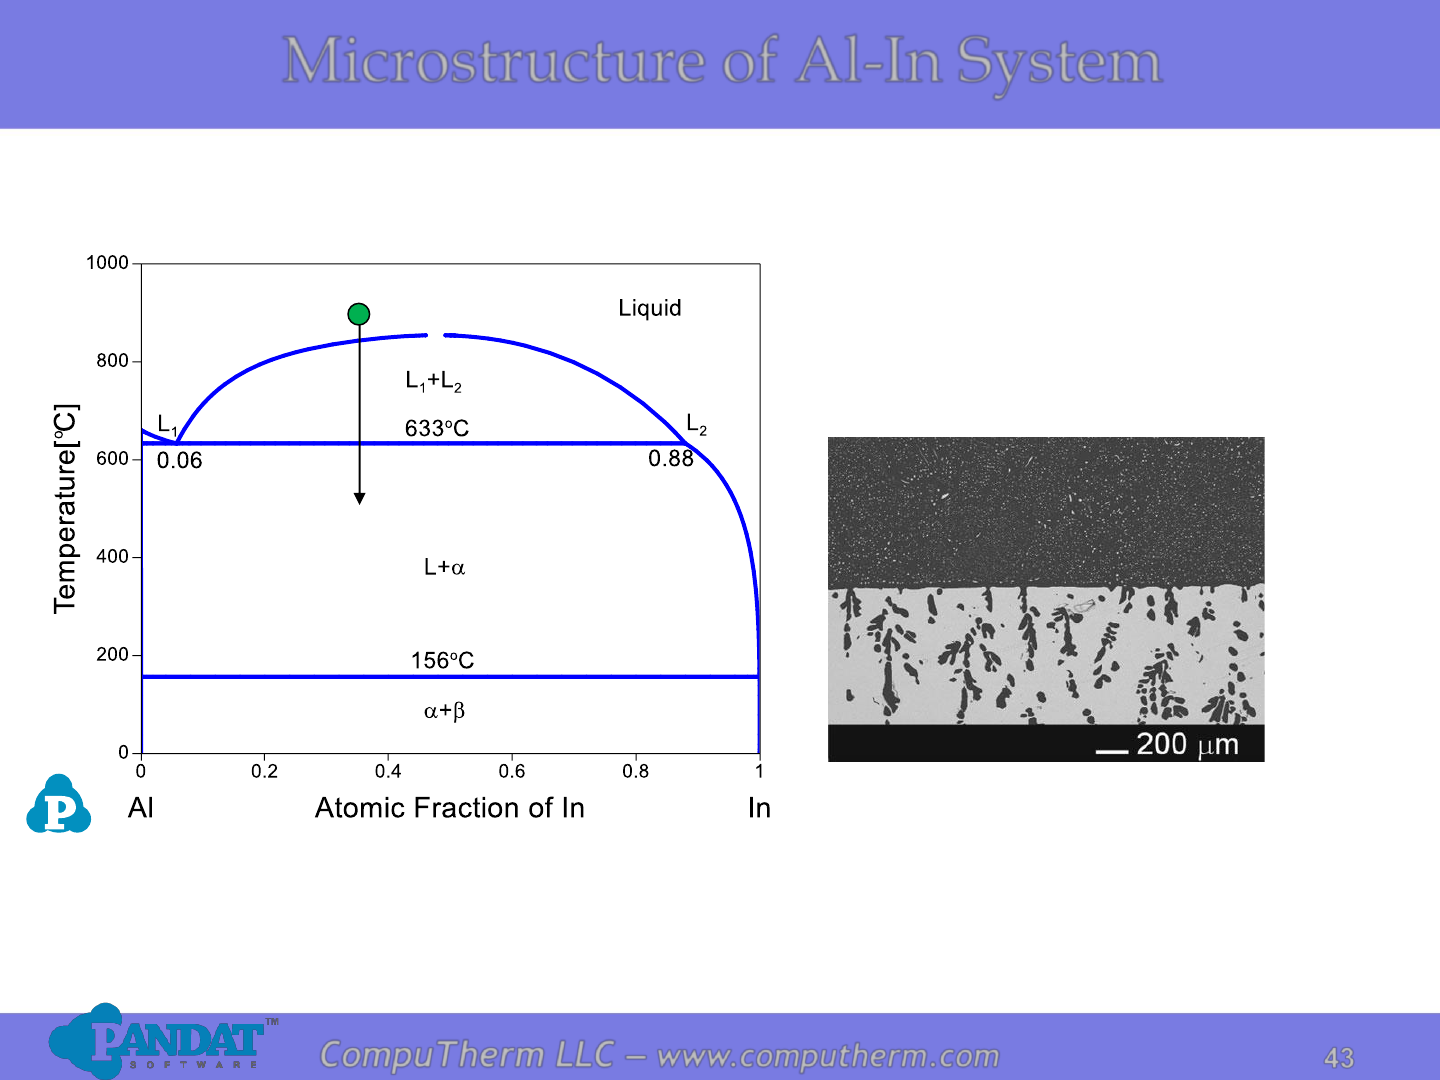
Microstructure of Al-In System
Al-rich
In-rich
Al
64
In
36
Photo from J Mater Sci (2012) 47:8360–8366.
The Al
64
In
36
(at.%) alloy in a graphite
container solidified at about 0.25 K/s
resulting in one layer on top of another.
44
44
CompuTherm LLC – www.computherm.com
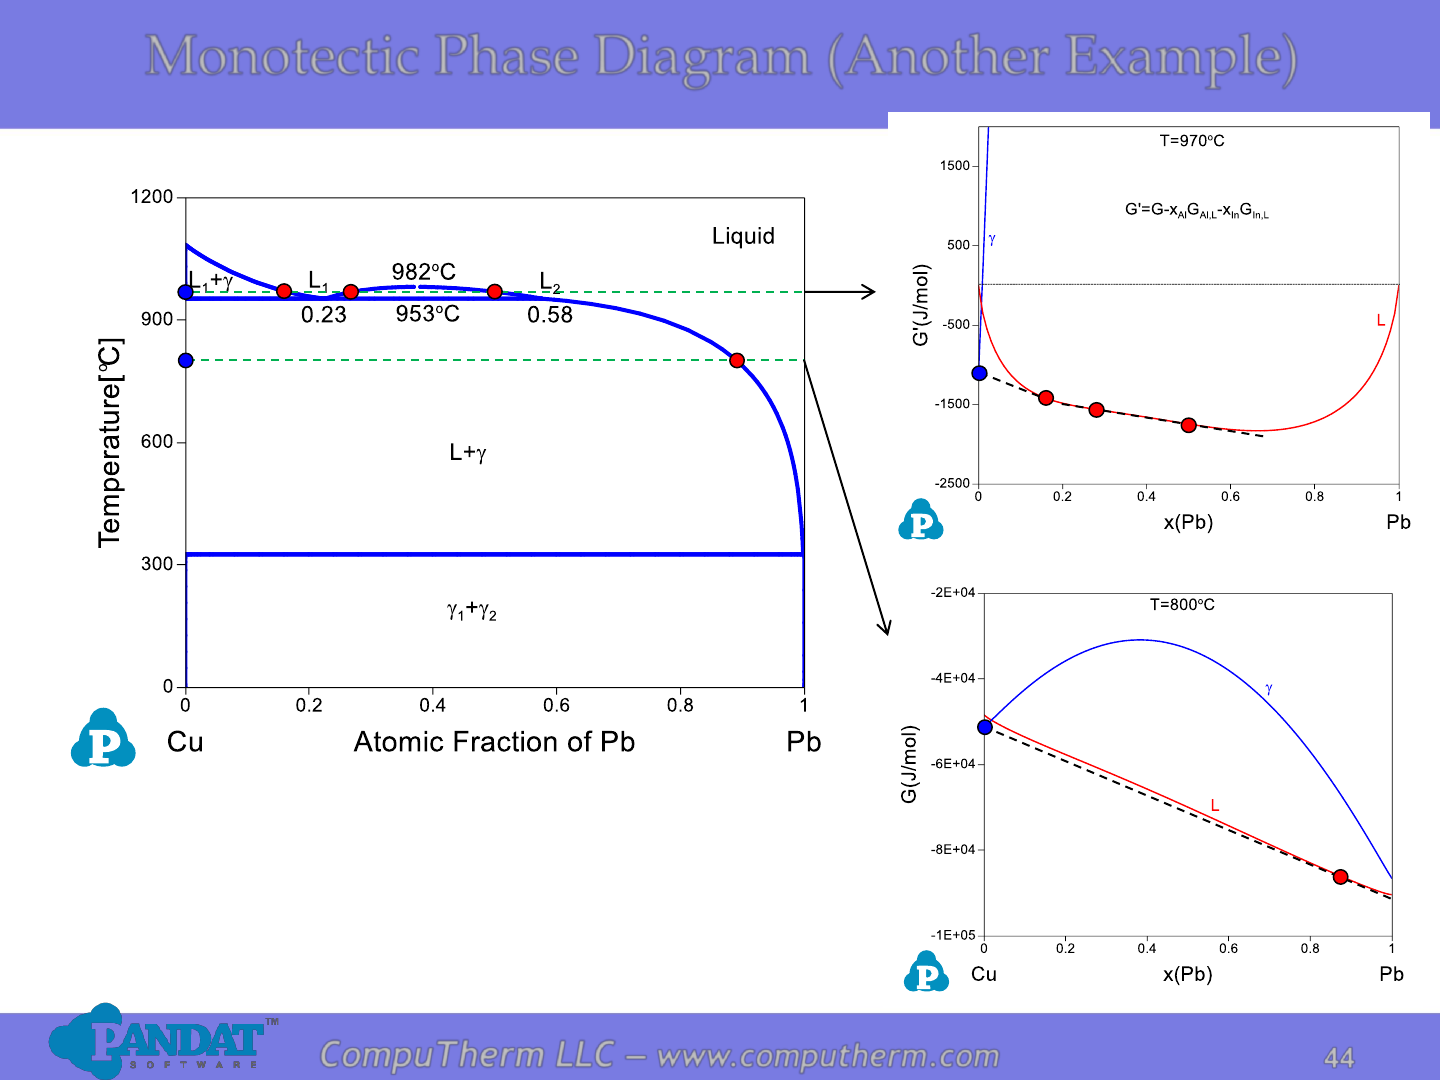
Monotectic Phase Diagram (Another Example)
Details Refer to:
1. Database: Database_Monotectic_Cu-Pb.tdb
2. Tutorial Video: Binary_Monotectic

45
45
CompuTherm LLC – www.computherm.com
Types of Binary Phase Diagrams
• Isomorphous Systems
• Eutectic Systems
• Eutectoid Systems
• Peritectic Systems
• Peritectoid Systems
• Monotectic Systems
• Syntectic Systems
46
46
CompuTherm LLC – www.computherm.com
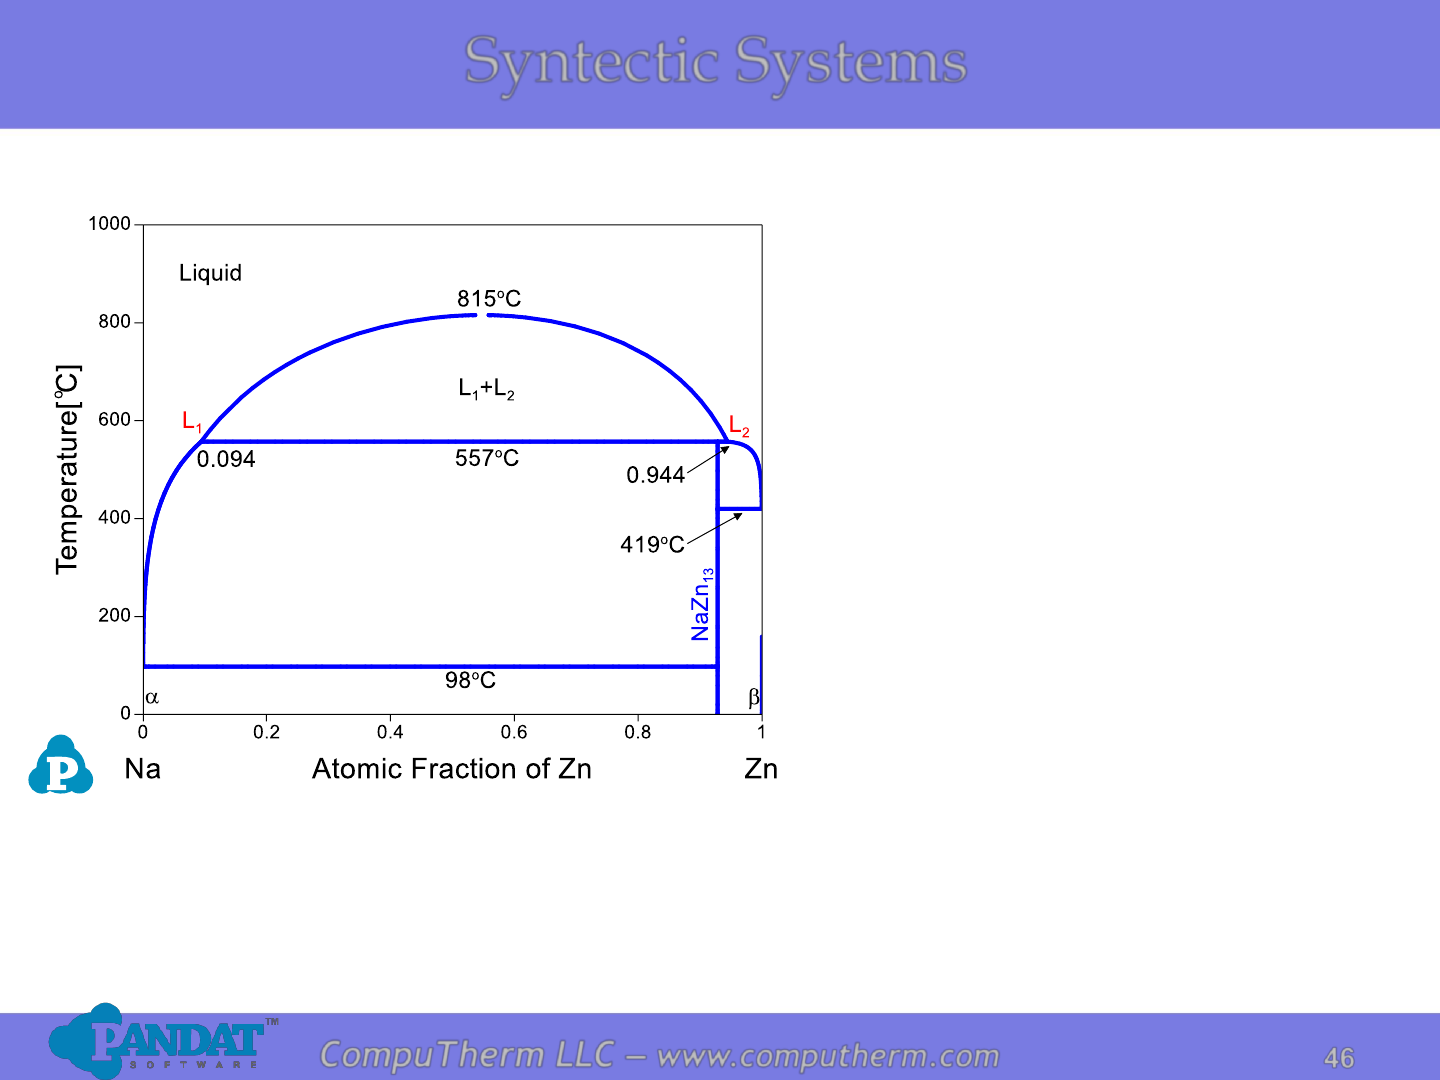
Syntectic Systems
Information from this diagram:
• Syntectic reaction occurs at
557
o
C: L
1
+ L
2
↔ NaZn
13
.
• Alloys (x
Zn
<92.3at%) start to
melt at eutectic temperature
98
o
C: L ↔ a+NaZn
13
.
• Alloys (x
Zn
>92.3at%) start to
melt at eutectic temperature
419
o
C: L ↔ +NaZn
13
.
• Alloy (x
Zn
<9.4at% or
x
Zn
>94.4at%) becomes
complete liquid at liquidus.
• Alloy (9.4at%<x
Zn
<94.4at%)
becomes complete liquid
mixture (two liquids with
different compositions) at
557
o
C.
Details Refer to:
1. Database: Database_Syntectic_Na-Zn.tdb
2. Tutorial Video: Binary_Syntectic
47
47
CompuTherm LLC – www.computherm.com
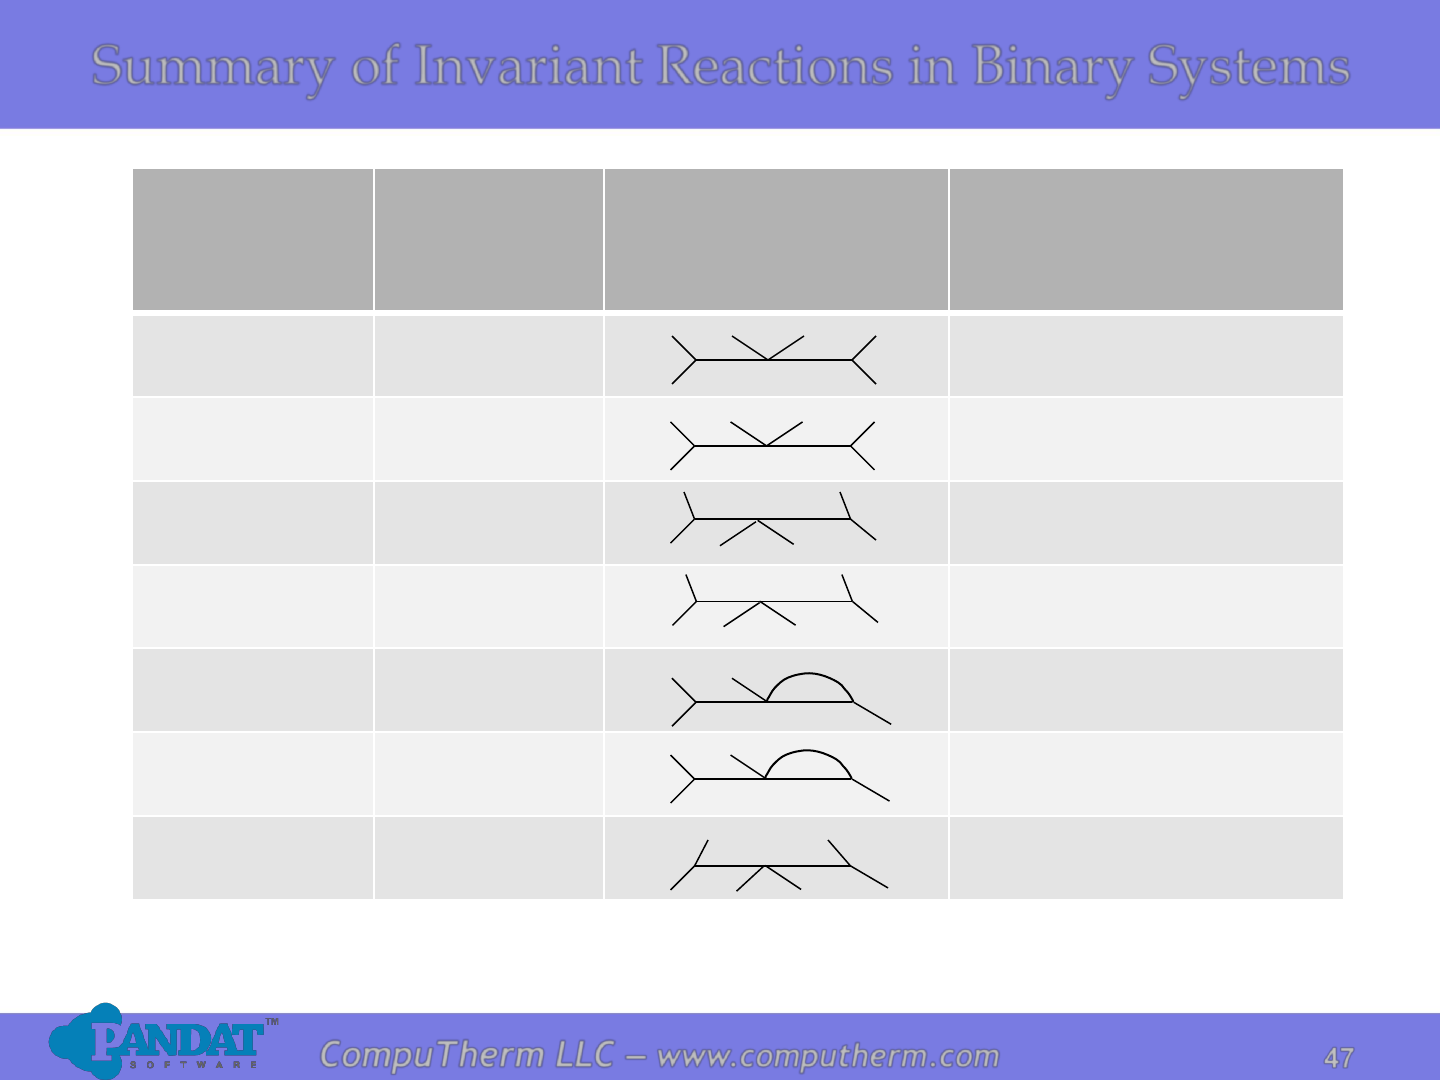
Reaction
Symbolic
equation
Schematic
presentation
Example
Eutectic
L↔
α+ β
Cu
-Ag, Pb-Sn, Al-Si
Eutectoid
α↔β+ γ
Fe
-C
Peritectic
L+
α↔β
Cu
-Fe, Pb-In
Peritectoid
α+ β↔γ
Al
-Cu
Monotectic
L
1
↔L
2
+ α
Cu
-Pb, Al-In
Monotectoid
α
1
↔α
2
+ β
Al
-Zn
Syntectic
L
1
+ L
2
↔α
Na
-Zn
L
a
a
g
L
a
a
g
a
L
2
L
1
a
L
2
L
1
Summary of Invariant Reactions in Binary Systems
a
2
a
1
48
48
CompuTherm LLC – www.computherm.com
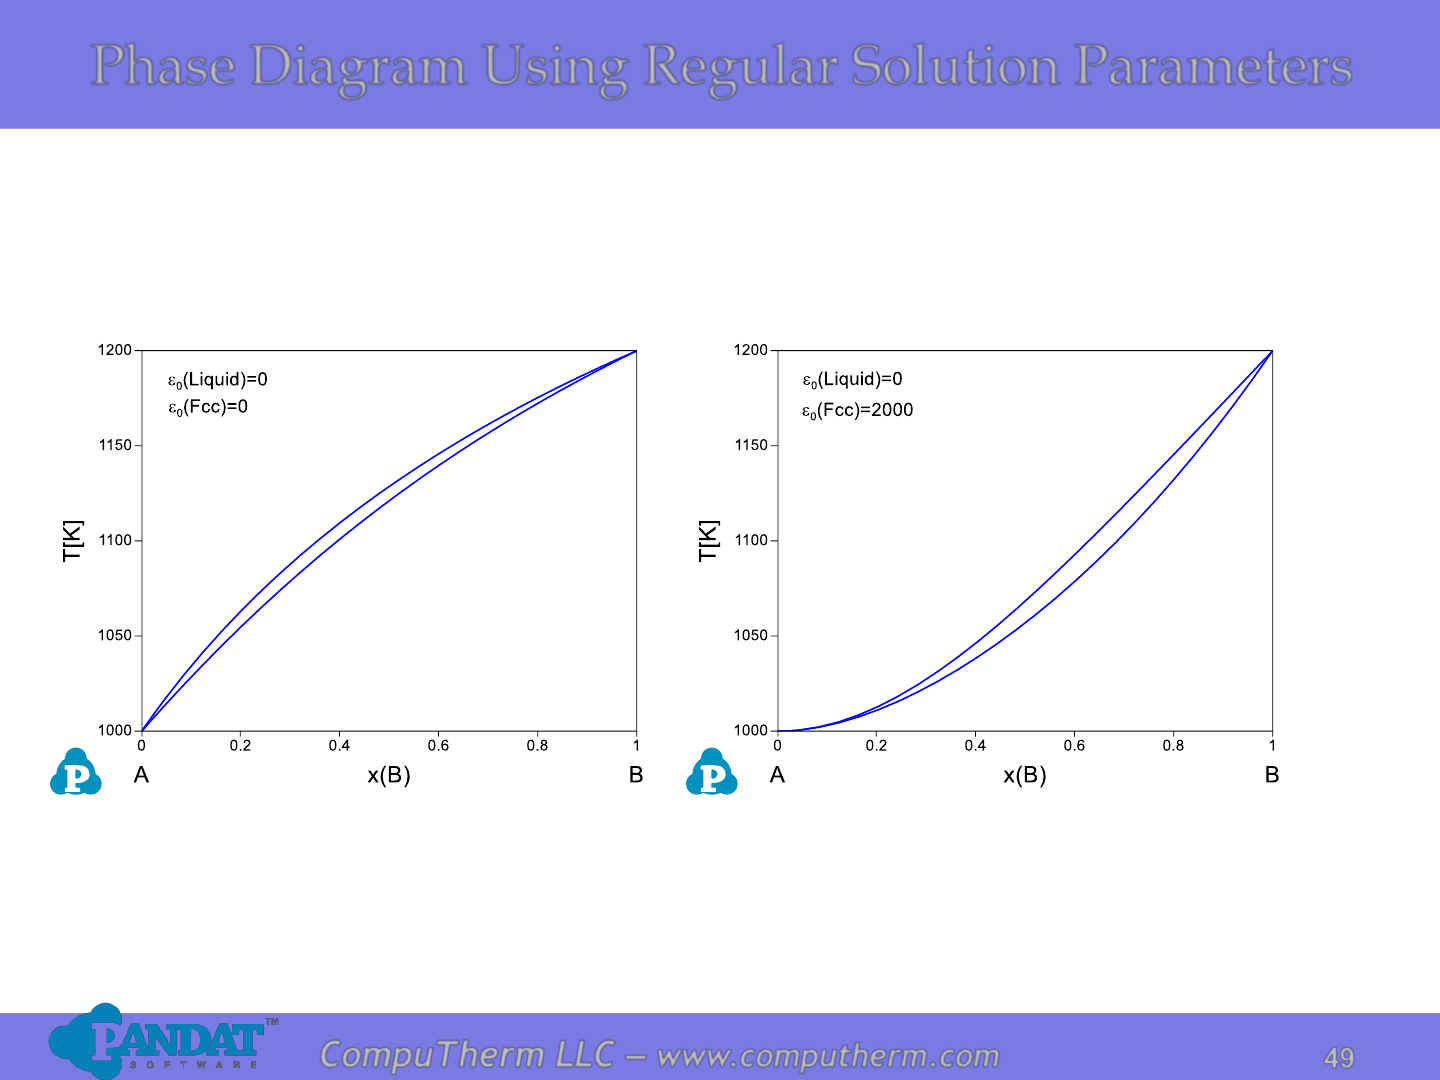
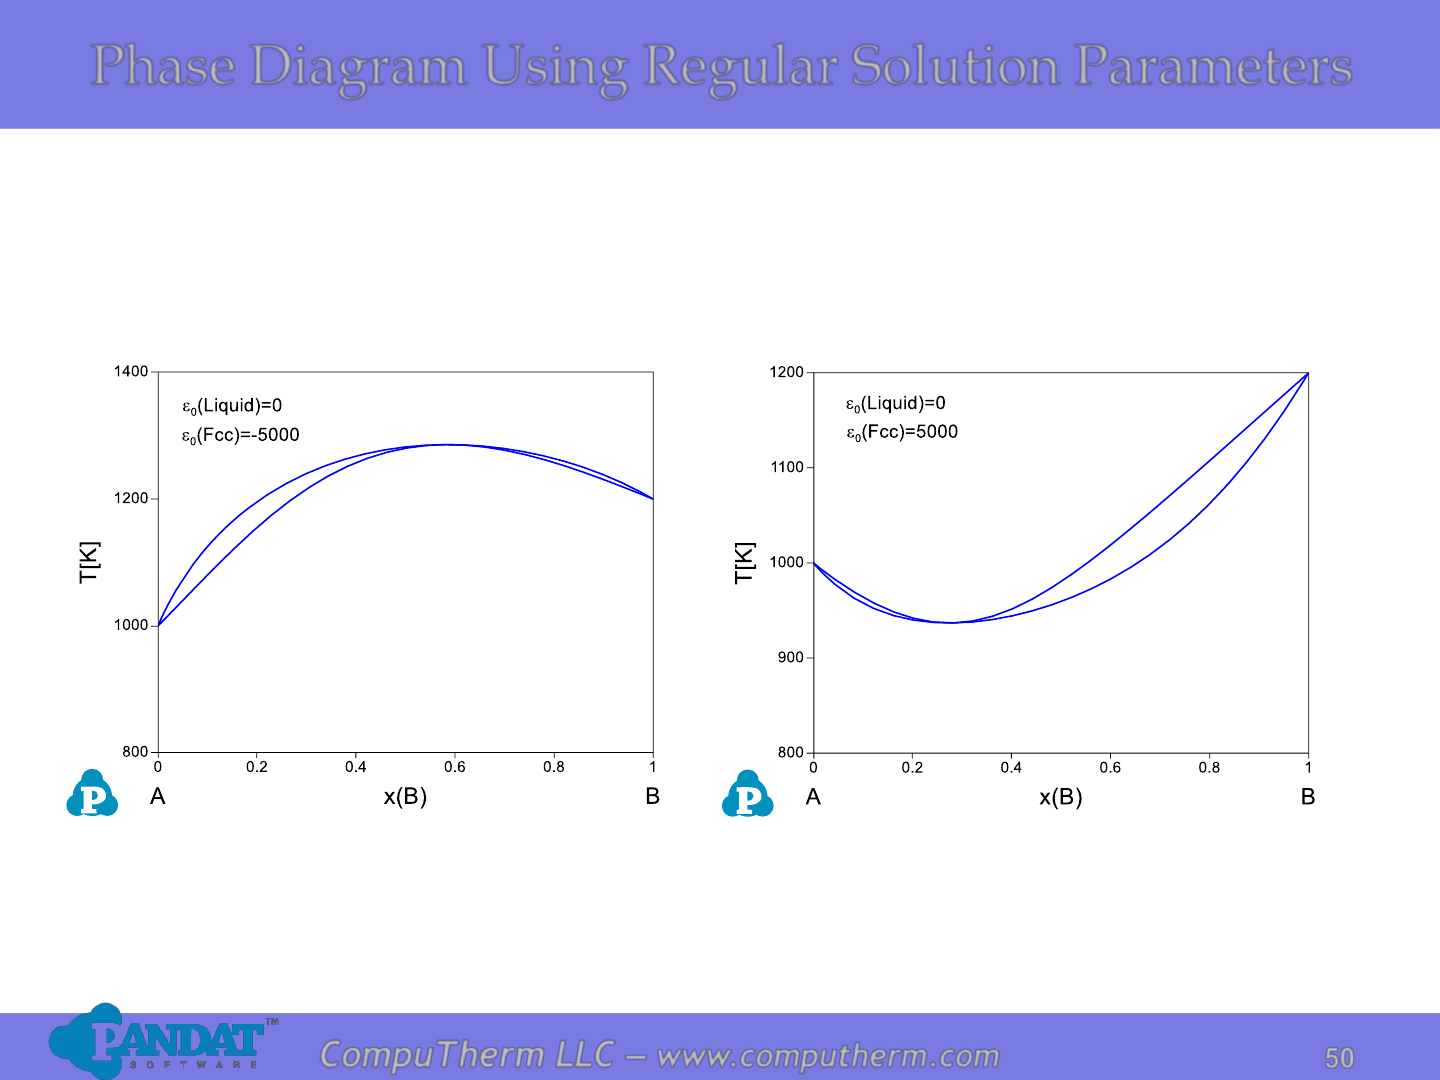
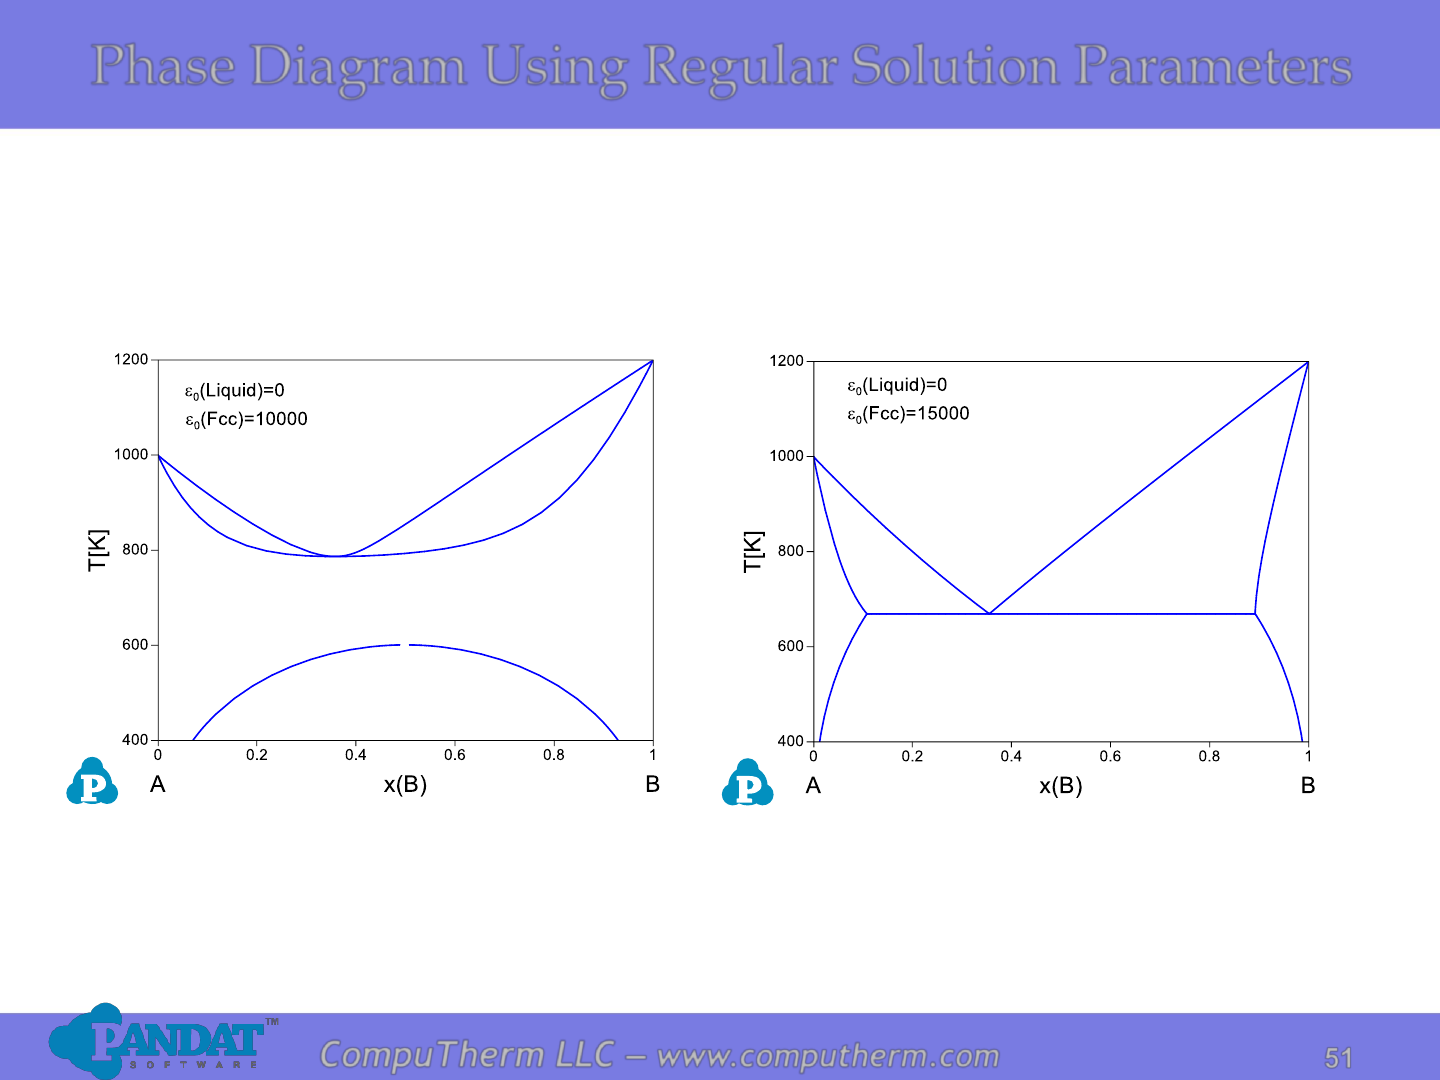
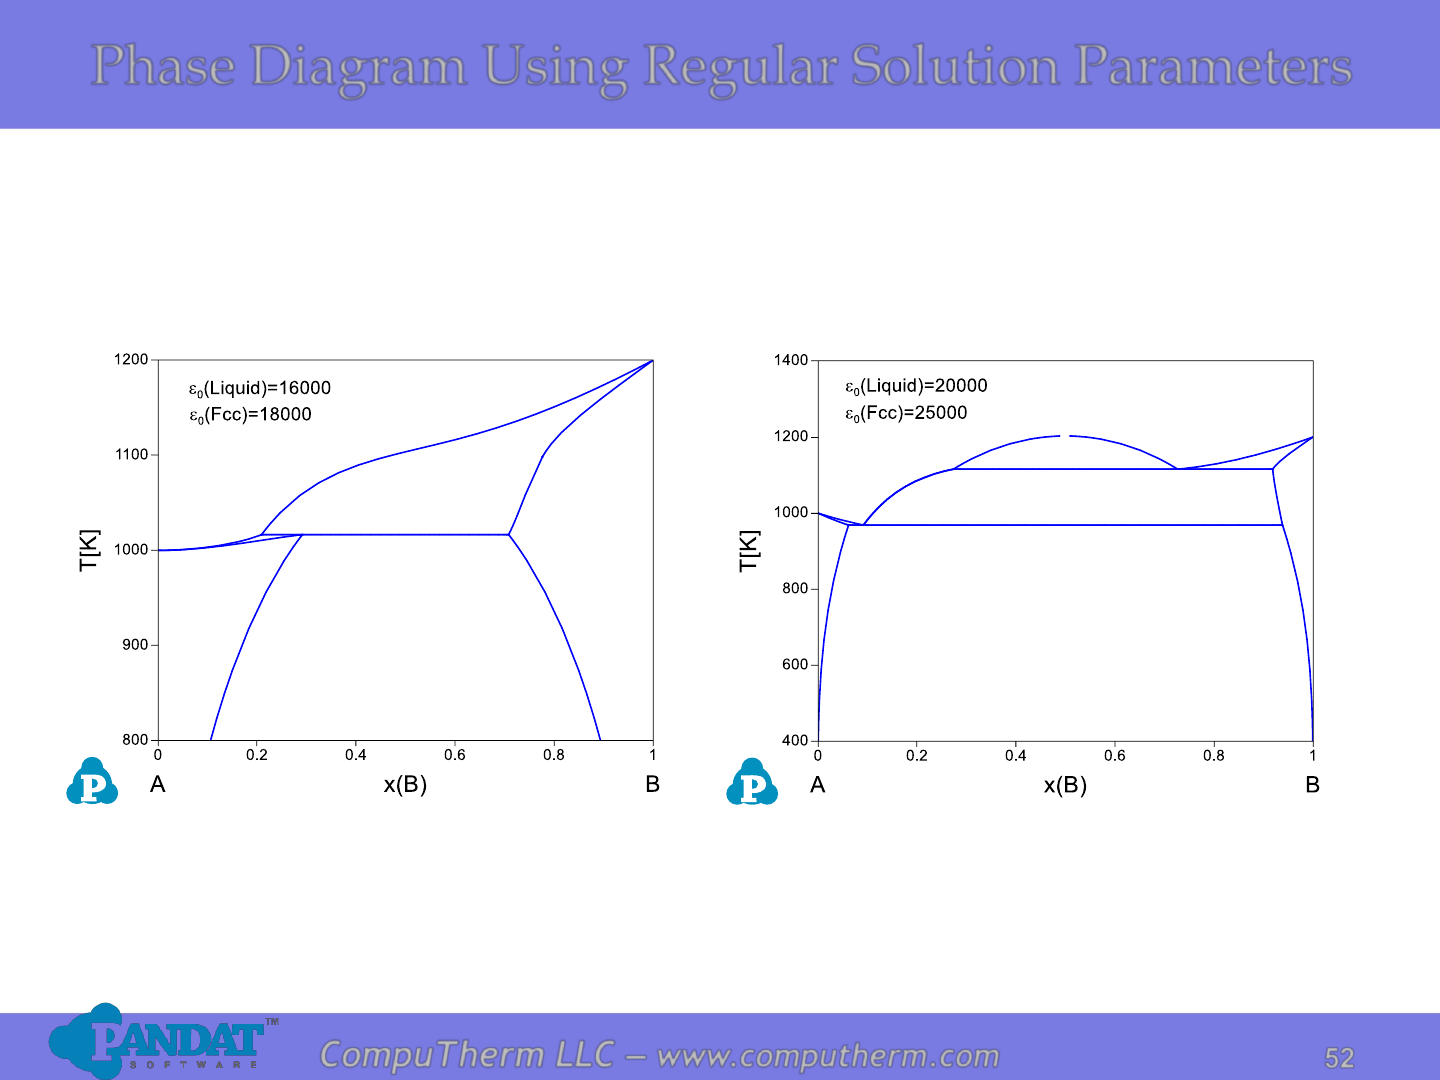
Binary Phase Diagrams
Use of regular solution model parameters to
generate different types of binary phase diagram
•Hypothetical elements A and B both present Fcc (a) structure in
their solid states.
•Both liquid and solid phases are described using regular solution
models.
( )
LL
B
L
A
L
B
L
B
L
A
L
A
L
B
L
B
L
A
L
A
L
xxxxxxRTGxGxG
0
,o,o
lnln
++++=
( )
aaaaaaaaaaa
0
,o,o
lnln
BABBAAB
L
BAA
xxxxxxRTGxGxG ++++=
49
49
CompuTherm LLC – www.computherm.com
Phase Diagram Using Regular Solution Parameters
50
50
CompuTherm LLC – www.computherm.com
Phase Diagram Using Regular Solution Parameters
51
51
CompuTherm LLC – www.computherm.com
Phase Diagram Using Regular Solution Parameters
52
52
CompuTherm LLC – www.computherm.com
Phase Diagram Using Regular Solution Parameters
53
53
CompuTherm LLC – www.computherm.com
Acknowledgement
• Many of the slides are reproduced based on the
book: Materials Science and Engineering: An
Introduction, 8
th
Edition, William D. Callister, Jr.
David G. Rethwisch.

54
54
CompuTherm LLC – www.computherm.com
For Download
• The PowerPoint file and related thermodynamic
database files are available for downloading
under the directory: Resources/Downloads.
• Thank you for your interest.