1
1 Pandat Basics
Pandat
TM
software is an integrated computational tool developed on the basis of
the CALPHAD (CALculation of PHAse Diagram) approach for multi-component
phase diagram calculation and materials property simulation. It has a robust
thermodynamic calculation engine, a friendly graphical user interface, and a
flexible post-calculation table editing function which allows user to plot variety
types of diagrams. The software is designed to create a working environment
that allows variety of calculation modules be integrated in the same workspace.
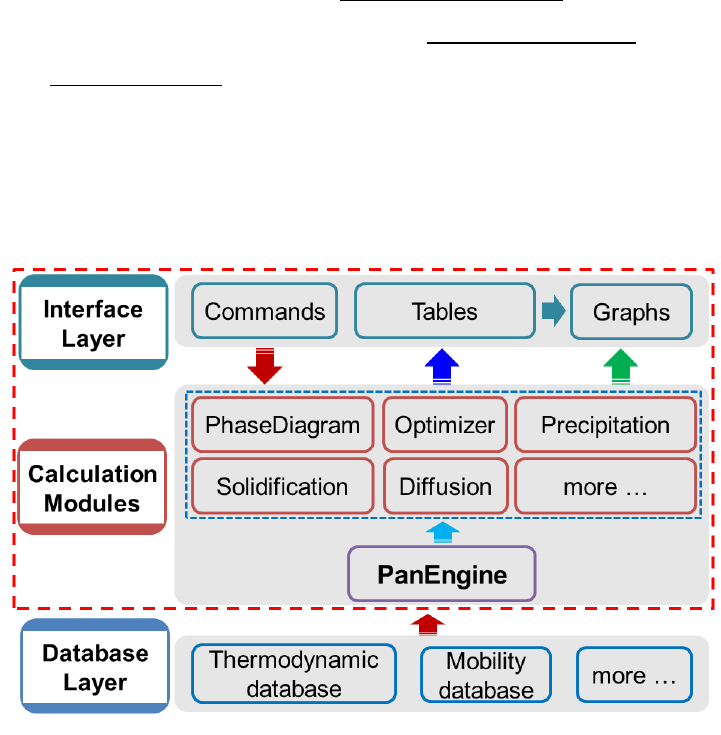
It currently includes five modules: PanPhaseDiagram (phase diagram and
thermodynamic property calculation), PanPrecipitation (precipitation
simulation), PanOptimizer (property optimization) PanDiffusion (diffusion
simulation) and PanSolidification (solidification simulation). Other modules
can be easily integrated into the workspace for extended applications. The
architecture of Pandat
TM
software is schematically shown in the Figure 1.1.
Figure 1.1 The architecture of Pandat
TM
software
2
In addition to the functionalities provided by Pandat
TM
as a stand-alone
program being demonstrated in this manual, its calculation/optimization
engine (PanPhaseDiagram, PanOptimizer and PanPrecipitation) are built as
shared libraries and enable their integration with broader applications in the
field of Materials Science and Engineering. More detailed information about
Pandat software can be found in the published papers [2002Che, 2003Che,
2009Cao].
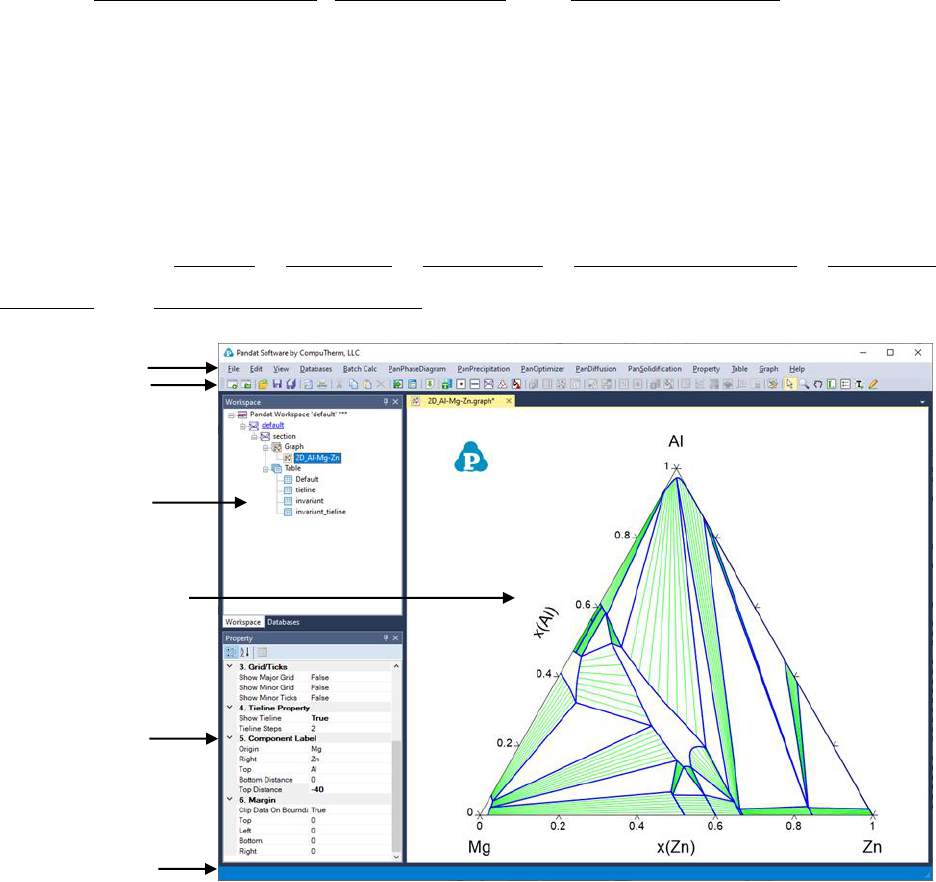
The PanGUI (user interface of the Pandat
TM
workspace) consists of six
components: Menus, Toolbars, Statusbar, Explorer window, Property
window and Main display window as shown in Figure 1.2.
Figure 1.2 The components of the PanGUI
Menus
Toolbars
Explorer
window
Property
window
Statusbar
Main display
window
3
1.1 Menus
Pandat menus provide commands for performing operations on the active
window and other general operations such as opening and saving a workspace
file (*.pndx) or turning on the display of a toolbar. The menus are context
sensitive; that is, they change as the context in Pandat
TM
Main display window
changes. This ensures that only Context-relevant menus and menu commands
are displayed.
1.2 Toolbar
Pandat
TM
provides toolbar buttons for the frequently used menu commands.
Like the menu commands, toolbar buttons are also context-sensitive.
When a toolbar button is pointed at with the mouse, a "tool-tip" displays the
button name.
1.3 Statusbar
The Pandat
TM
Status bar is located at the bottom of the workspace. If the
cursor is on a graph, the coordinates are displayed in the status bar.
1.4 Explorer window
The Explorer window lists the contents in the current workspace. The contents
are displayed in a tree structure. By clicking each node, the text, graph or table
will be displayed in the Main display window of Pandat
TM
. A node of a
calculation result could be deleted.
1.5 Main display window
The Main display window displays the text, graph or table which corresponds
to each node in the Explorer window.
4
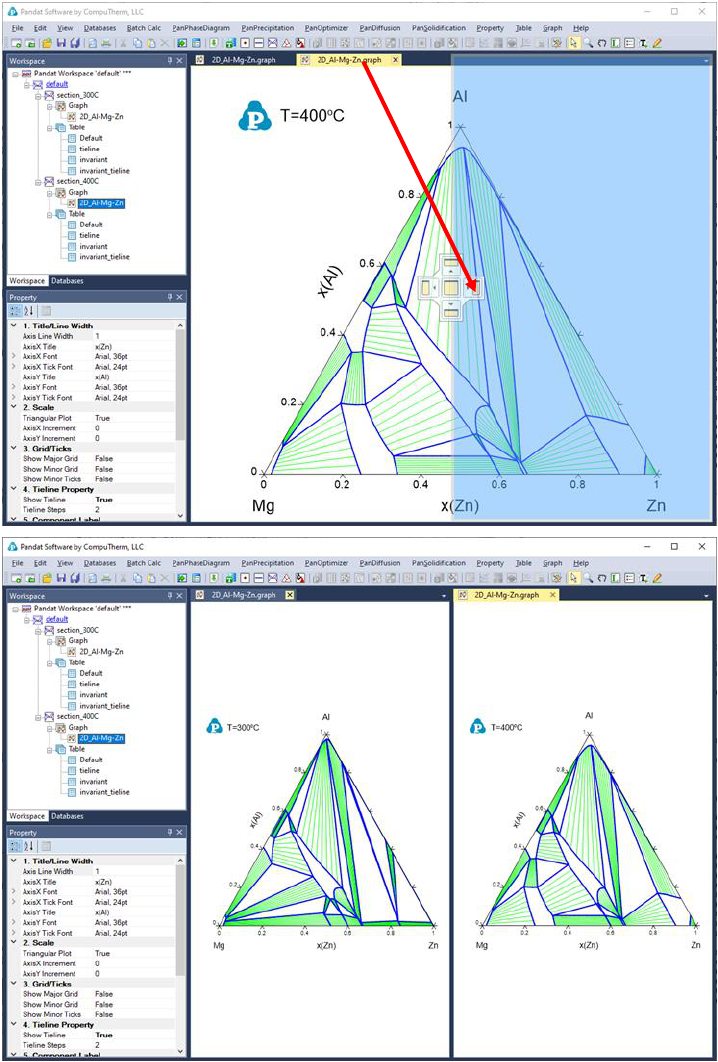
More than one graph or table can be opened and their titles are displayed on
the top bar of the Main display window. User can display several plots together
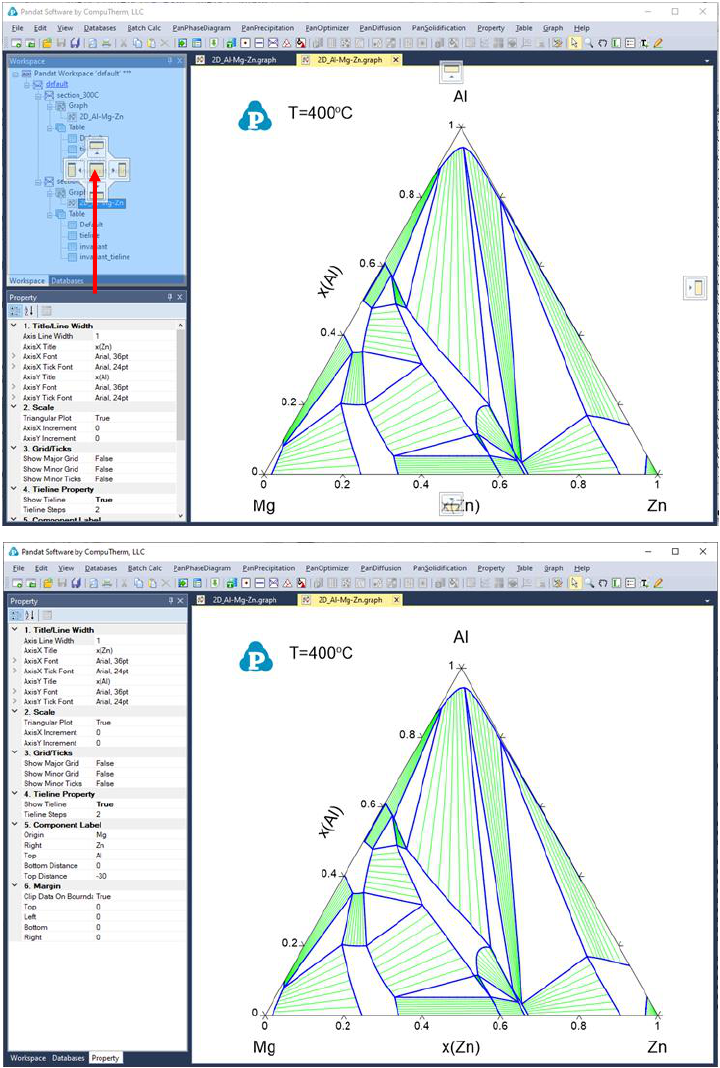
in the Main display window by moving them to different positions. The
following Figure 1.3 and Figure 1.4 show how to move these windows. Select
the window on the top bar, hold the left button and move the mouse toward the
Main display window. A dialog showing relative positions will be displayed.
Move the mouse to the selected position and release the left button of the
mouse. Figure 1.3 shows moving the selected window to the right side and
Figure 1.4 shows moving the selected window (the Property Window) to the
center position.
5
Figure 1.3 Rearrange the display window of Pandat
TM
, before and after
6
Figure 1.4 Rearrange the explore and property windows of Pandat
TM
, before and
after